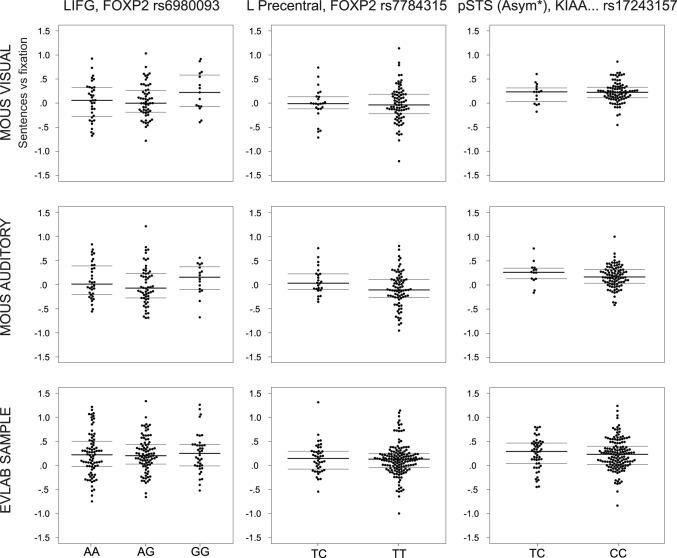
Figure 2.
Single-subject contrast estimates by genotype group. The data points are horizontally jittered for visibility. The median as well as the first and third quartiles are shown as horizontal bars. For FOXP2 rs6980093 in the original study, there was a negative relationship between the number of G alleles and the BOLD response (AA>AG>GG) to reading or listening to sentences in left inferior frontal gyrus. This finding was not replicated in either modality in the MOUS cohort, nor in the EvLab cohort. For FOXP2 rs7784315 in the original study, the TC group had higher BOLD response in the left precentral gyrus when reading sentences, which is not replicated in any subsample in the current study. The corresponding results for the MOUS auditory subsample are reported for completeness, although we stress that there was no significant effect in the original study. For rs1724315 at the KIAA0319/TTRAP/THEM2 locus, the original results showed greater functional asymmetry of the posterior STS for the CC compared with the TC group in the visual subsample, which is also not replicated in any subsample in the current study. The corresponding results for the MOUS auditory subsample are reported for completeness.

