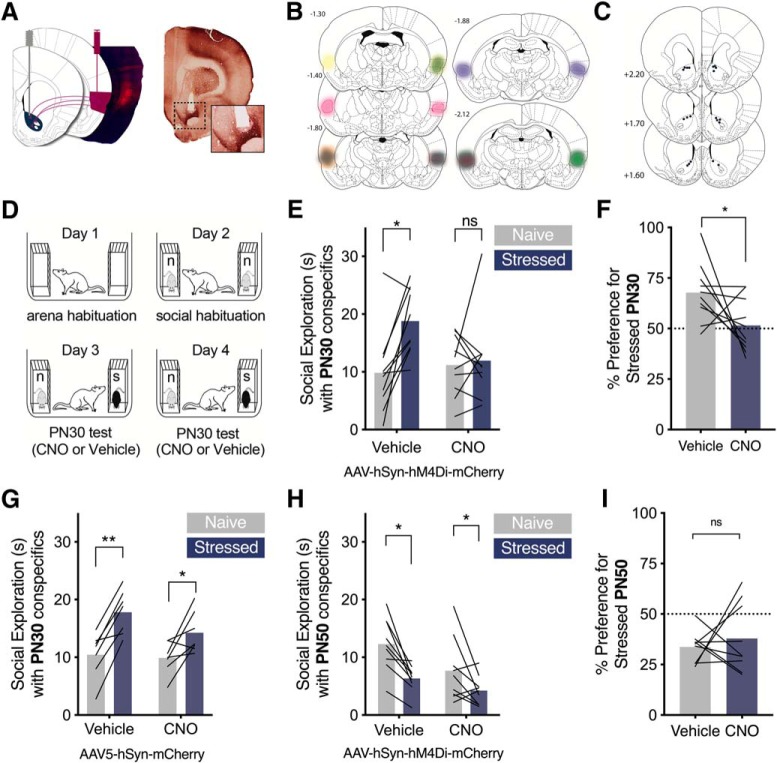
Figure 4.
Chemogenetic inhibition of IC → NAc terminals blocked the social affective preference for stressed PN30 conspecifics. A, Schematic of IC neurons transduced with pAAV5-hSyn-hM4D(Gi)-mCherry in IC and cannula implanted in NAc and representative image of virus transduction (left, red = native mCherry, blue = DAPI) and verification of cannula tip in NAc with terminal fiber expression (right, mCherry immunoreactivity). B, Summary of mCherry expression in IC (n = 10); bold outlines represent the region of maximum mCherry expression and the corresponding faded overlay depicts the full extent of virus transduction. C, Summary map of cannula tip placements in NAc. D, Diagram of behavioral procedures; treatment order on days 3 and 4 was counterbalanced. E, Mean (with individual replicates, n = 10) time spent exploring the naive and stressed PN30 conspecifics during the 5 min SAP test. Vehicle-treated rats spent more time exploring the stressed PN30 conspecifics than the naive PN30 conspecifics (p = 0.023), which was abolished via 1 μm CNO injections 45 min before testing through the guide cannula. F, Data from E presented as the percentage preference for the stressed conspecific. Experimental rats show a preference to explore the stressed conspecific under vehicle treatment, which was significantly reduced after pharmacological inhibition of IC terminals in NAc in CNO (p = 0.033). G, To control for nonspecific effects of CNO in the NAc, a separate cohort of sham experimental rats without hM4D(Gi) transduction underwent the SAP test. Under vehicle treatment, rats preferred to explore the stressed PN30 conspecifics (p = 0.003), which was maintained after microinfusion of 1 μm CNO to the NAc 45 min before testing (0.031). H, Mean (with individual replicates, n = 9) time spent exploring the naive and stressed PN50 conspecifics during the 5 min SAP test after vehicle or 1 μm CNO injections. Test rats spent more time exploring the naive conspecifics than the stressed PN50 conspecifics regardless of injection (main effect of stress, p = 0.003). I, Data from H presented as the percentage preference for the stressed conspecific; scores did not differ between vehicle and drug groups. (ns) indicates non significant difference. *p < 0.05, **p < 0.01.

