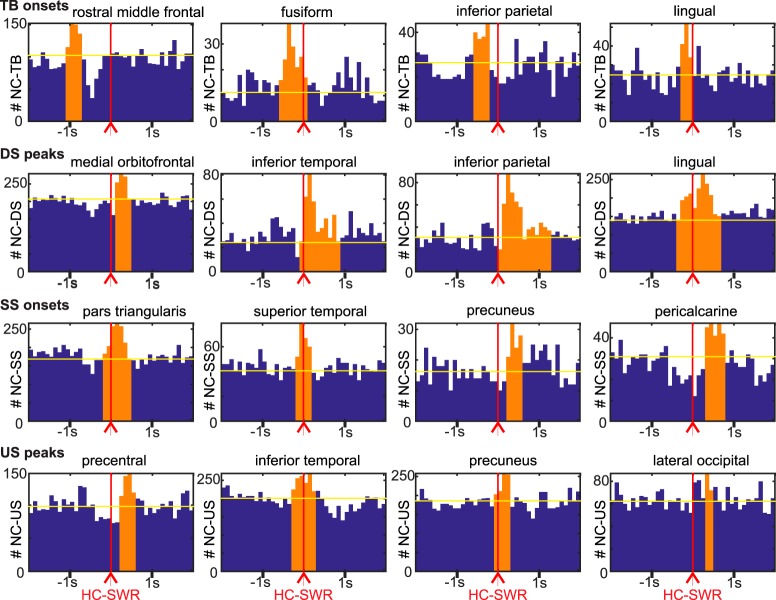
Figure 2.
NC-GEs in relation to HC-SWRs (example channel pairs). Each row of histograms is for a different type of GE: TBs, DS peaks, spindle onsets (SSs), and US peaks. The four columns of plots show example histograms with significant temporal correlations between HC-SWRs and NC-GEs from the frontal, temporal, parietal, and occipital lobes, respectively. Red vertical lines indicate trigger (SWR) location for the peristimulus histograms. Orange bars represent the time ranges with both peak NC-GE occurrence rate and significant correlation. Yellow horizontal lines indicate the mean baseline established via averaging randomized control distributions. A summary of the numbers of events across histograms can be found in Extended Data Figure 2-1.

