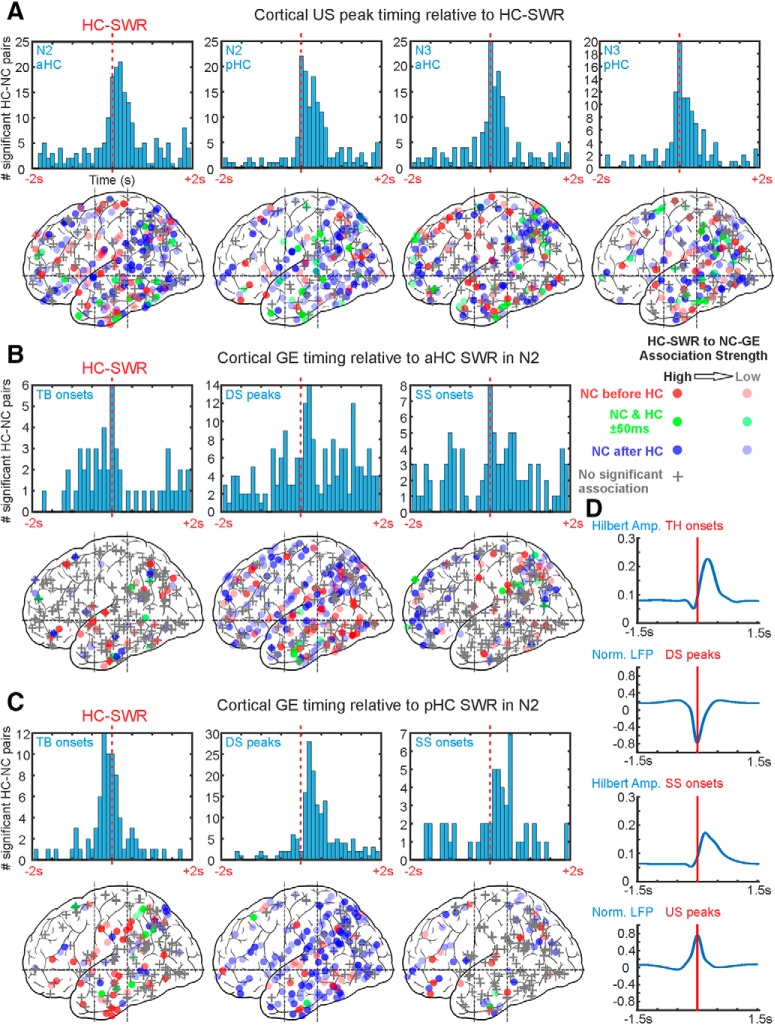
Figure 3.
NC-GEs tend to co-occur with HC-SWRs at consistent latencies. A–C, Top, Histograms of peak latencies for HC-NC channel pairs with significant temporal correlations between HC-SWRs and NC-GEs. Each count is the peak latency of a particular HC-NC channel pair (i.e., each histogram in Fig. 2 would contribute one count to one of the histograms in this figure). Bottom, Maps of peak latency between SWR and GE for cortical channels. Circles represent where GE-SWR relationships are significant. +, Nonsignificant channels. The intensity of each circle corresponds to the strength of GE-SWR coupling estimated (as in Fig. 2). The color of each circle represents peak latency: red represents GE before SWR; blue represents GE after SWR; green represents GE co-occurring with SWRs (i.e., within 50 ms of each other). Both hemispheres, and medial and lateral cortical sites, are superimposed in each plot. A, NC-USs tend to follow both aHC and pHC SWRs in both N2 and N3. B, NC-TBs tend to precede pHC SWRs, whereas other NC-GEs tend to follow. C, NC-TBs tend to precede aHC-SWRs, whereas NC-SSs tend to follow. B, C, Stage N2 NREM sleep. Stage N3 results are shown in Extended Data Figure 3-1, and DS-US transition results are shown in Extended Data Figure 3-2. Statistics from further analyses on the nonhomogeneity of spatial distributions for NC sites significantly coupled to HC-SWRs can be found in Extended Data Figure 3-3, Extended Data Figure 3-4, and Extended Data Figure 3-5. D, Average traces of NC-GE Hilbert amplitude (for TB/SS) and LFP (for DS/US) centered on TB/SS onsets and DS/US peaks, showing the durations of each NC-GE type.

