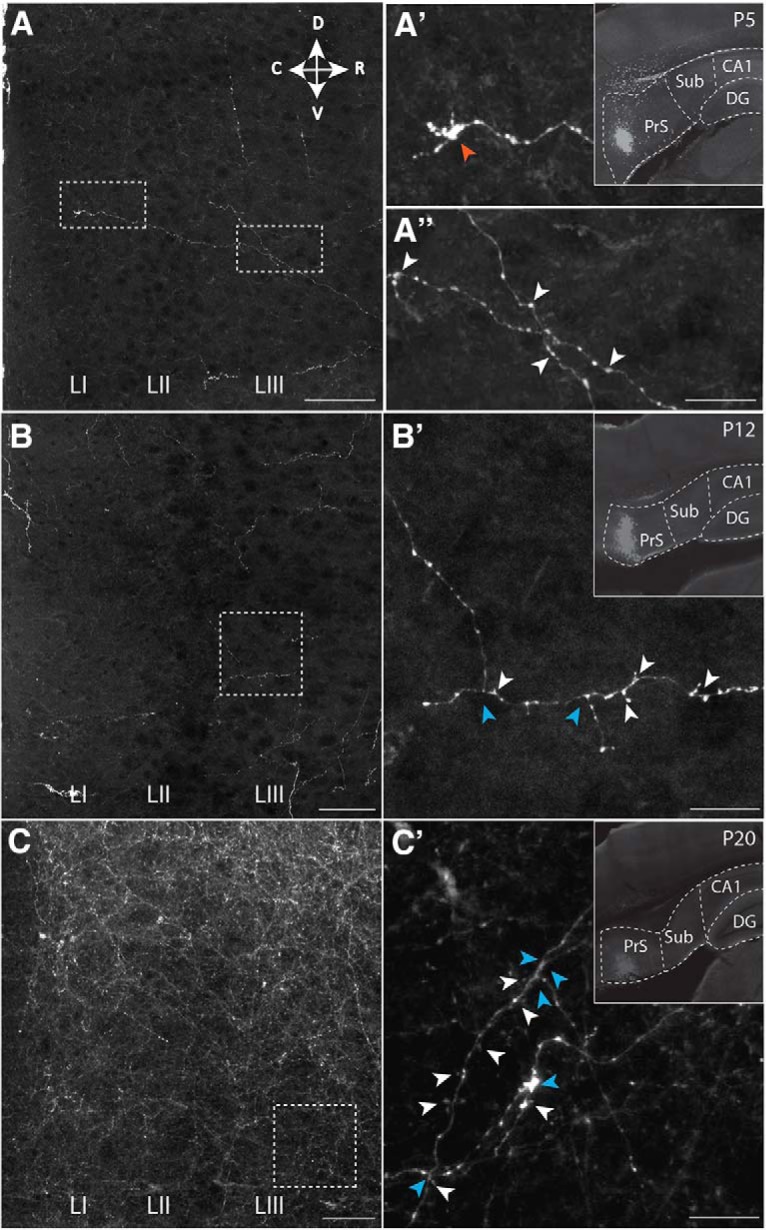
Figure 2.

Postnatal development of projections from PrS to MEC. The presynaptic side. A–C, Representative area in MEC showing labeling of presubicular axons in layers I-III in MEC at (A) P5, (B) P12, and (C) P20. A′, B′, C′, Higher-magnification images of areas indicated with white boxes in A–C. Indicated are an example of a growth cone (red arrowhead), varicosities, likely reflecting presynaptic elements (white arrowheads), and axonal branching points (blue arrowheads). Insets, The anterograde tracer injection sites in PrS. Dashed lines indicate brain areas and layers. Scale bars: A–C, 500 μm; A′–C′, 100 μm. DG, dentate gyrus; CA1, field CA1 of the hippocampus; Sub, subiculum.
