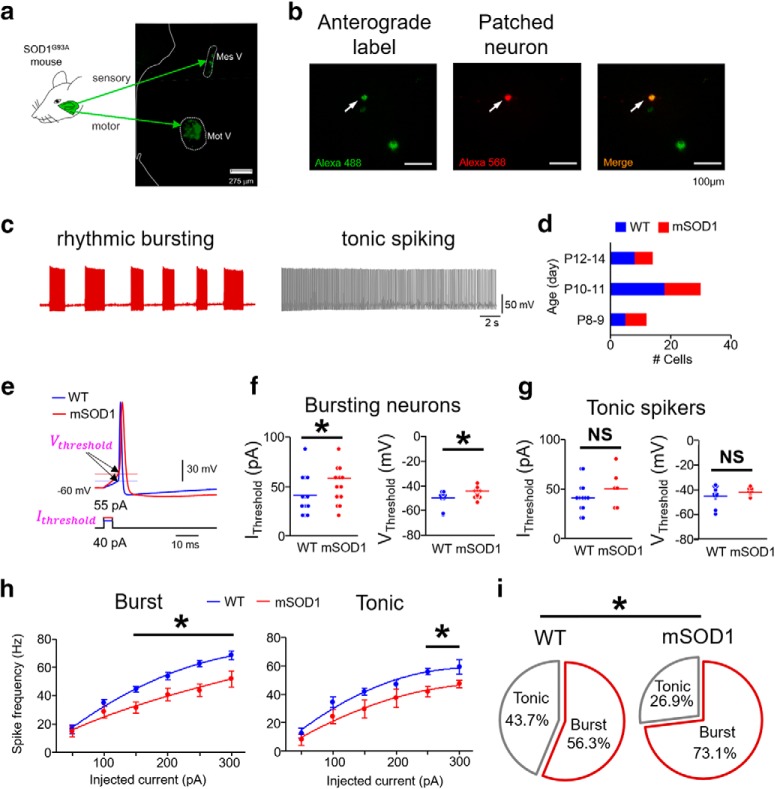
Figure 1.
Impaired excitability in intrinsically bursting mSOD1 Mes V neurons. a, Schematic represents the Ia proprioceptive sensory and motor nuclei of the trigeminal jaw control circuit identified using anterograde/retrograde tracer injection in jaw closer muscles in the SOD1G93A mouse (or mSOD1). Left half of a coronal pontine section is shown. Mes V, Trigeminal mesencephalic sensory nucleus; Mot V, trigeminal motor nucleus. White dotted enclosures represent both nuclei. b, Left, Anterogradely labeled Mes V neurons (green). Middle, Dye-filled (red) Mes V neuron during patch-clamp recording. Right, A merged image highlighting the double-labeled neuron. c, Representative examples of discharge patterns in two classes of Mes V neurons. Left, A rhythmic bursting neuron (maroon). Right, A tonic spiking neuron (right). These discharge patterns are induced by a 200 pA depolarizing step current for 20 s duration. d, Bar charts represent the age distribution of the mice, including 24 WT mice (n = 32) and 21 mSOD1 mice (n = 26), where n is the number of cells for all the data presented. e, A single near-threshold spike in a WT (blue) and a mSOD1 (red) Mes V neuron generated in response to a brief (5 ms) step depolarization. The corresponding injected current threshold (Ithreshold) (bottom) and membrane voltage threshold (Vthreshold) for spike generation (top, horizontal lines and arrows) are highlighted (magenta). f, g, Dot plots represent Ithreshold (left) and Vthreshold (right) in bursting (f) and tonic (g) Mes V neurons. Blue and red horizontal lines indicate average group values. f, For bursting neurons, *p < 0.05 (above horizontal line), for Ithreshold and Vthreshold. g, For tonic spiking neurons, NS (above black horizontal line) indicates no statistically significant group differences between WT and mSOD1 cells. h, Spike frequency-injected current responses in bursting (left) and tonic spiking (right) Mes V neurons: blue represents WT; red represents mSOD1. *p < 0.05 (above horizontal line), between WT and mSOD1 cells for injected current ≥ 150 pA. i, Pie charts represent proportional distribution of bursting and tonic spiking neurons in WT and mSOD1 mice. *p < 0.05.

