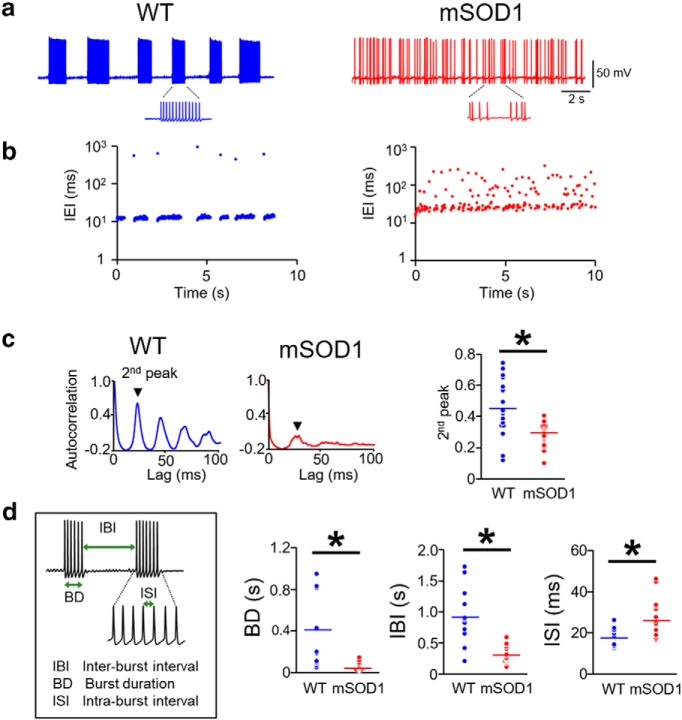
Figure 2.
Arrhythmic burst discharge in mSOD1 Mes V neurons. a, Representative examples showing rhythmic bursting in a WT (blue) Mes V neuron (left), and arrhythmic bursting in a mSOD1 (red) Mes V neuron (right). b, Time series plots of IEIs corresponding to the examples shown in a highlight IEI irregularities (IEIs are shown on log scale). c, Autocorrelation function of the membrane voltage in a WT (left) and mSOD1 Mes V neuron (middle); second peak is highlighted. Right, Dot plots represent the second peaks in WT (blue) and mSOD1 (red) bursting neurons. d, Left, Inset, The timing properties of bursts. Dot plots represent significantly reduced burst duration (BD), IBIs, and increased ISIs in the mSOD1 (red) Mes V neurons compared with WT (blue). c, d, n = 14 (WT) and n = 16 (mSOD1), where n is the number of bursting cells. *p < 0.05 (above the black horizontal line).

