Figure 3.

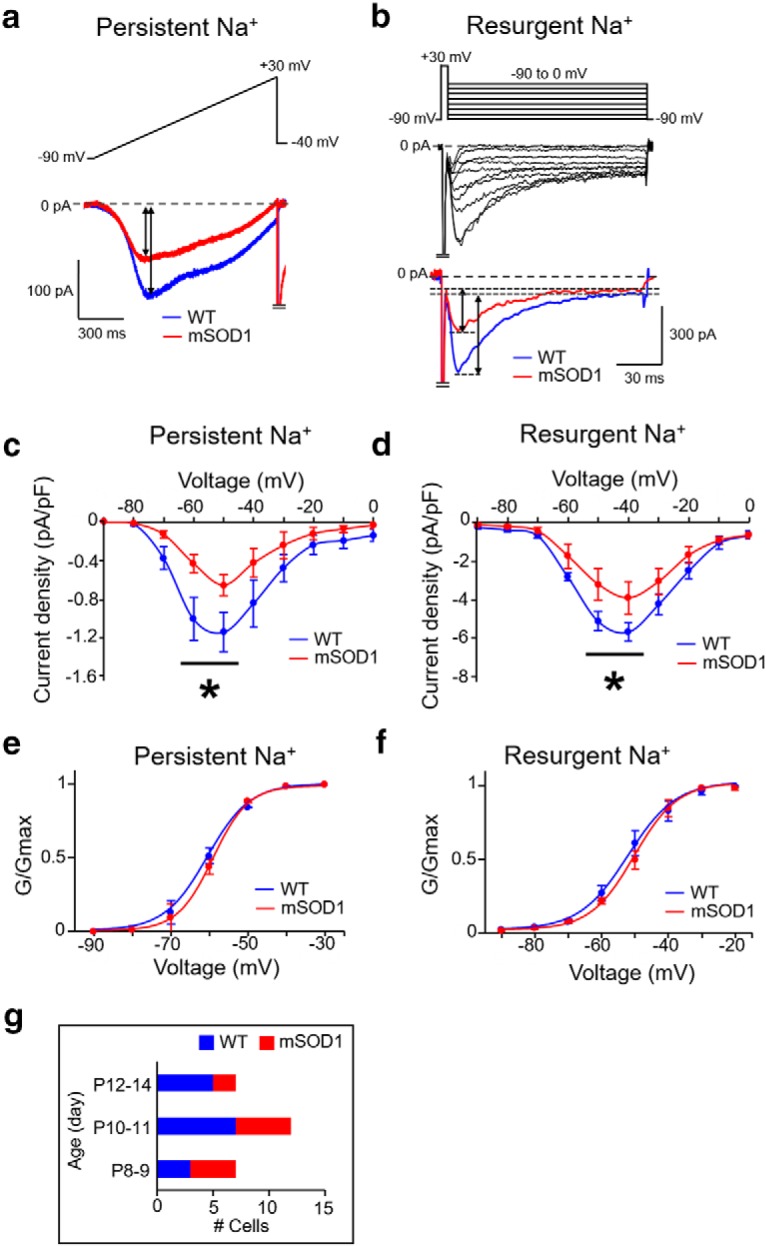
Reduced Nav 1.6-type Na+ currents in mSOD1 Mes V neurons. a, b, Representative current traces from whole-cell voltage-clamp experiments showing a reduction in TTX-sensitive persistent Na+ (a) and resurgent Na+ (b) currents in mSOD1 Mes V neuron (red), compared with WT (blue). Top, Voltage-clamp protocol. Bottom, Current responses. Voltage-clamp protocol in a consists of a ramp voltage from −90 to 30 mV at 100 mV/s, and in b, consists of a brief, 5 ms step from −90 to 30 mV, to evoke a transient Na+ current, followed by repolarization to voltages between −90 and 0 mV to elicit resurgent Na+ current due to open-channel unblock. c, d, Current-voltage relationships of the peak persistent (c) and resurgent (d) Na+ current densities in mSOD1 Mes V neurons (red). c, Asterisk (above the black horizontal line) indicates statistically significant reduction in peak current amplitudes at subthreshold activation voltages between −60 and −50 mV for persistent Na+ peaks in mSOD1 (red) compared with WT (blue). d, Asterisk (above the black horizontal line) indicates statistically significant reduction in peak current amplitudes at repolarization voltages of −50 and −40 mV for resurgent Na+ peaks in mSOD1 (red) compared with WT (blue). e, f, Boltzmann curves fit to the normalized peak conductances as a function of activation voltages for persistent (e) and resurgent (f) Na+ currents in WT (blue) and mSOD1 (red) Mes V neurons. g, Bar charts represent the age distribution of the mice, including 8 WT mice (n = 14) and 6 mSOD1 mice (n = 11), where n is the number of cells for all the data presented in c–f.
