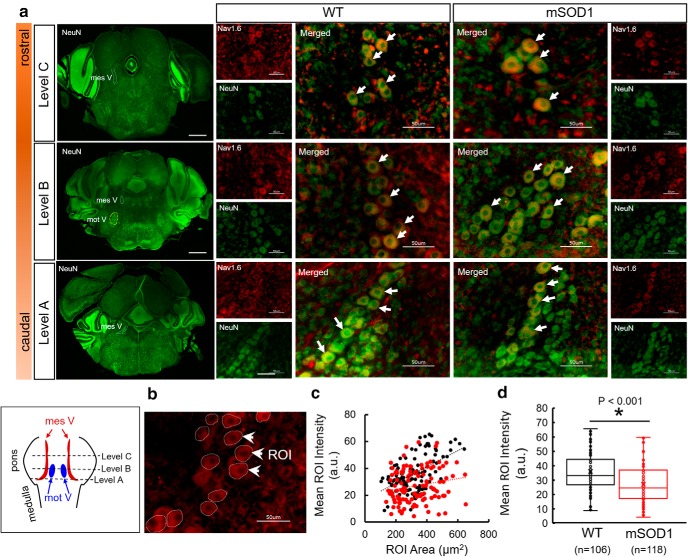
Figure 4.
Immunofluorescent quantification of Nav1.6 protein expression in WT and mSOD1 Mes V cells. a, Representative images showing three rostro-caudal levels of coronal brainstem sections, stained with NeuN (left column of images). Scale bar, 500 μm. In these images, the Mes V nucleus is highlighted with dashed contours. At Level B, the subjacent trigeminal motor nucleus (mot V) is highlighted. For each level, comparative images consisting of Mes V neurons from WT and mSOD1 mice are shown at 60× magnification. Green represents NeuN. Red represents Nav1.6 protein. Merged images are shown enlarged with white arrows highlighting representative Mes V neurons. Left, Bottom, Boxed inset represents the pontine levels at which sections were collected. b, Representative image showing ROIs drawn at ∼12 Mes V neurons for immunofluorescence quantification. White arrows indicate three representative ROIs. c, Scatterplot showing WT (black circles) and mSOD1 (red circles) values of ROI area and mean intensity quantification. Trendlines show a positive linear regression. d, Box plots represent mean ROI intensity per cell for WT (black) and mSOD1 (red), respectively. n values indicate number of cells obtained from 4 WT and 4 mSOD1 mice across 9 and 8 sections, respectively. A two-tailed Student's t test was used for statistical comparison.

