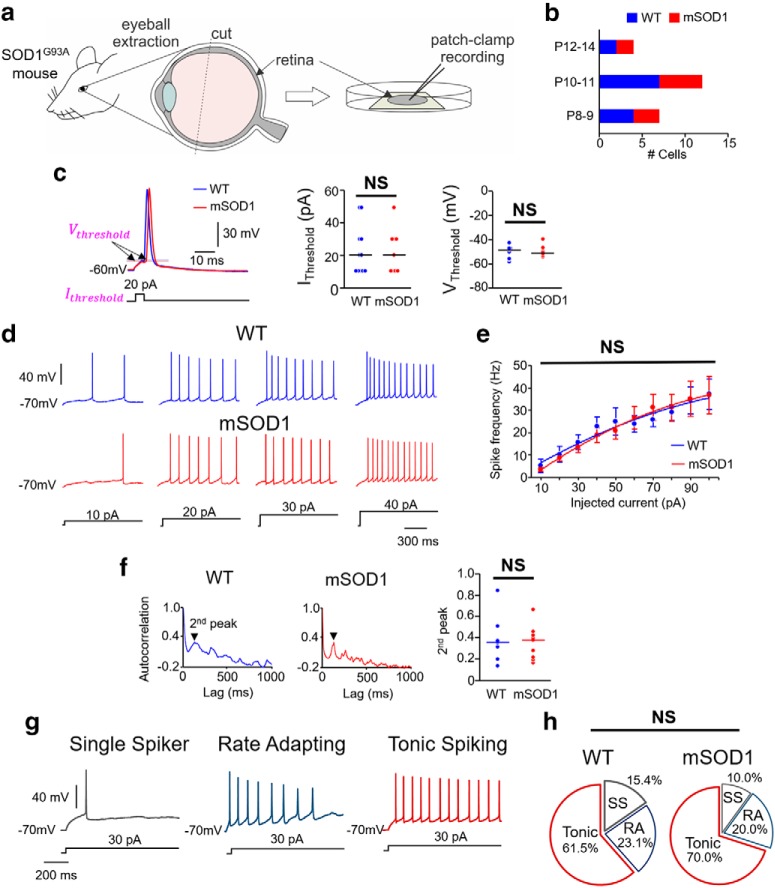
Figure 7.
Excitability of primary sensory neurons in the retina of mSOD1 mice. a, Schematic showing retina extraction for patch-clamp recording. b, Bar charts represent the age distribution of the mice, including 7 WT mice (n = 13) and 5 mSOD1 mice (n = 10), where n is the number of cells for all the data presented in c–h. c, Inset, Current (IThreshold) and voltage (VThreshold) thresholds for action potentials in WT (blue) and mSOD1 (red) RG neurons. Dot plots represent comparison of these properties between WT (blue) and mSOD1 (red) RG neurons tested. f, Representative membrane voltage responses to increasing levels of 1 s current injection (bottom) in repetitively firing WT and mSOD1 RG neurons. g, Spike frequency-injected current responses in all the RG neurons that showed repetitive firing. h, Autocorrelation function of membrane potential in WT (left) and mSOD1 (middle) RG neurons. Second peaks (arrows) are highlighted. Right, Dot plots represent the second peaks for all the cells with no significant difference between WT (blue) and mSOD1 (red) TG neurons. g, RG neurons were classified into three types: single spikers (SS), rate adapting (RA), and tonic spiking (for details, see Results). d, Percentage of the subtypes of RG neurons in WT and mSOD1 mice are not significantly different.

