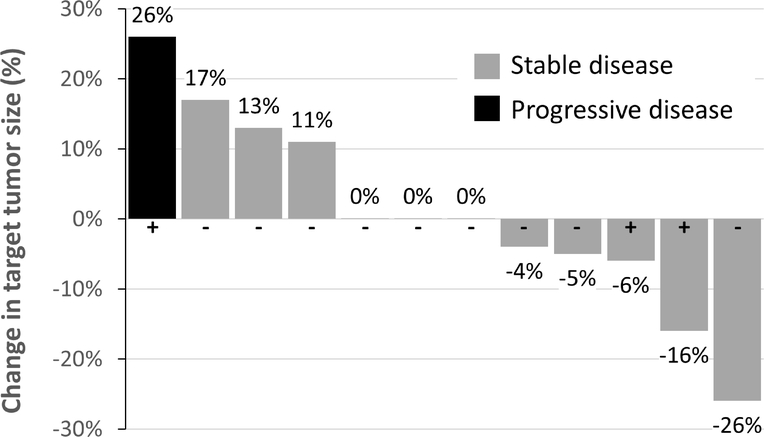
Figure 3. Waterfall Plot of Change in Tumor Burden.
Percent change from baseline in the sum of longest diameters of target lesion(s) for each study patient. Radiographic assessments were performed at a median (range) of 20.5 (15–26) days from first CDX-3379 dose. HPV status is denoted by + and − signs.

