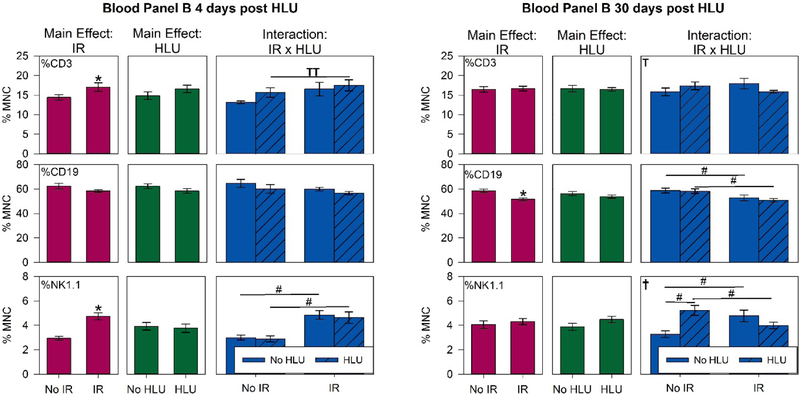
Figure 8:
Major lymphocyte subpopulations in the blood. T (CD3+), B (CD 19+) and NK (NK1.1) cell counts are presented as percentages of all mononuclear cells (MNC). Data were obtained using fluorescence-labeled monoclonal antibodies and flow cytometry Mice were euthanized and blood was collected in ethylenediaminetetraacetic acid (EDTA)-coated syringes via inferior vena cava (IVC) at 4 or 30 day post-unloading (11 and 37 days post-irradiation, respectively). Blood samples were analyzed using FACSCaliburTMflow cytometer. Three-Way ANOVA: * = P<0.05, main effect of proton irradiation (IR) or HLU. †=P<0.05, IR x HLU interaction. T =P<0.1, IR x HLU interaction. Post hoc Tukey test: # =P<0.05, TT =P<0.1.

