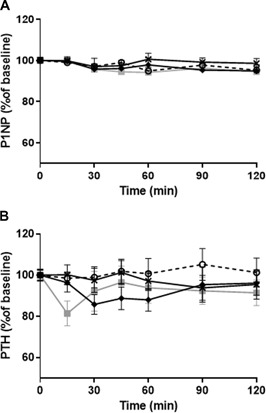
Figure 2.

GLP‐1 effect on P1NP and PTH. (A) Mean P1NP levels ±SEM shown as percent of basal level (calculated as mean of –10 and 0). (B) Mean PTH levels ±SEM shown as percent of basal level (calculated as mean of –10 and 0 min). Grey square = GLP‐1 (7‐36)amide; black cross = GLP‐1 (9‐36)amide;black diamond = exenatide; open circle, dashed line = placebo.
