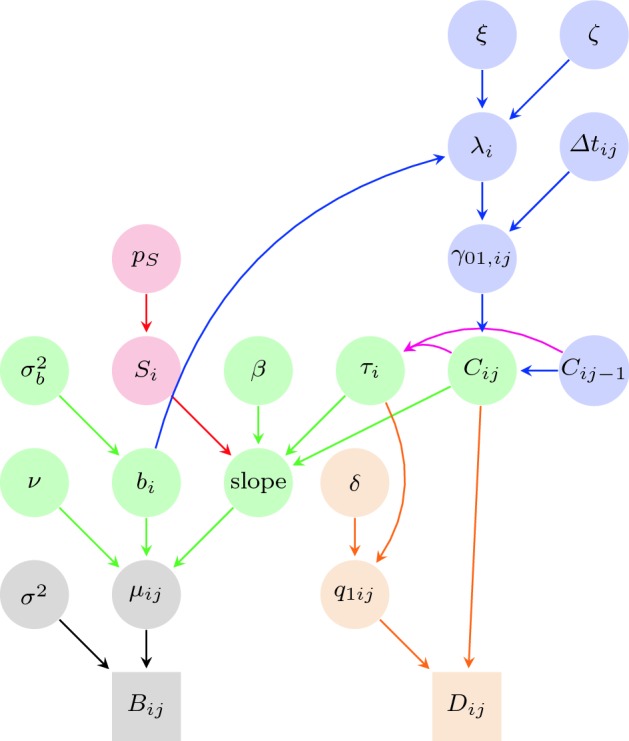
Fig. 1.

Directed graph representing the hierarchical model. The grey components correspond to the conditional distribution for the observed GALAD scores; the green components to the specification of the mean underlying GALAD score over time; the red components to the mixture distribution to account for the behaviour of biomarkers given a tumour present; the blue components to the underlying latent process of disease status; and the orange components to represent the diagnosis observation, given the disease status of an individual (colour figure online)
