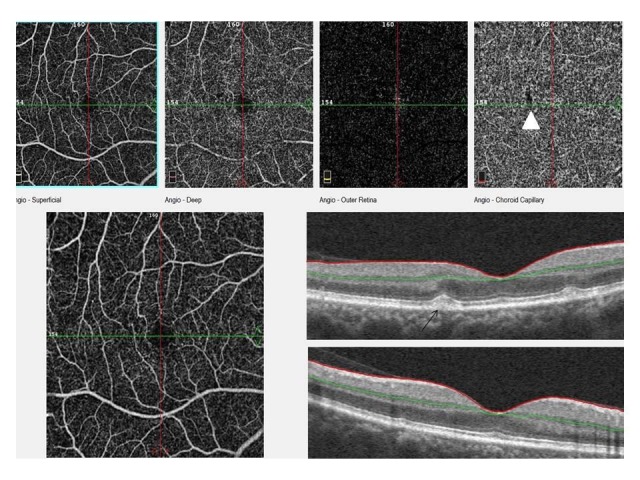
Fig. 3.

This image shows the superficial and deep capillary level, outer retina level and choriocapillaris level of OCTA scan and an OCT scan. Drusenoid PED is seen on OCT image (black arrow) and signal loss of drusen area is seen at choriocapillaris level on OCTA (white arrowhead)
