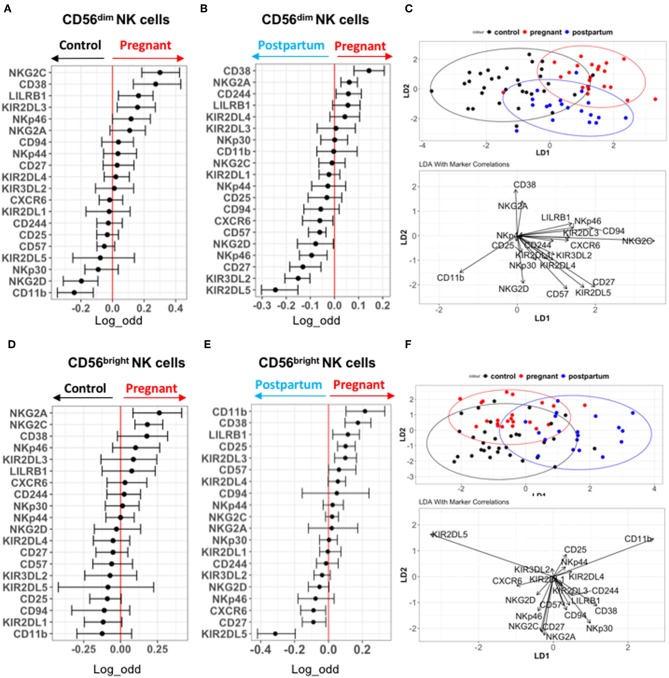
Figure 3.
Deep profiling of CD56dim and CD56bright NK cells in non-pregnant and pregnant women from validation cohort. (A,B) Markers predictive of CD56dim NK cells in control vs. pregnant women in validation cohort were assessed by GLM with bootstrap resampling. The markers are listed on the y-axis and the x-axis represents the log-odds that the marker expression levels predict the outcome (control on the left vs. pregnancy on the right). Summary data are depicted, showing the 95% confidence interval. Markers in which the bar does not cross zero are significantly predictive of one state vs. the other. (C) Represents the linear discriminant analysis (LDA) for CD56dim NK cells between non-pregnant, pregnant and post-partum samples from validation cohort. (D,E) Markers predictive of CD56bright NK cells in control vs. pregnant women in validation cohort were assessed by GLM with bootstrap resampling. The markers are listed on the y-axis and the x-axis represents the log-odds that the marker expression levels predict the outcome (control on the left vs. pregnancy on the right). Summary data are depicted, showing the 95% confidence interval. Markers in which the bar does not cross zero are significantly predictive of one state vs. the other. (F) Represents the linear discriminant analysis (LDA) for CD56bright NK cells between non-pregnant, pregnant and post-partum samples from validation cohort.

