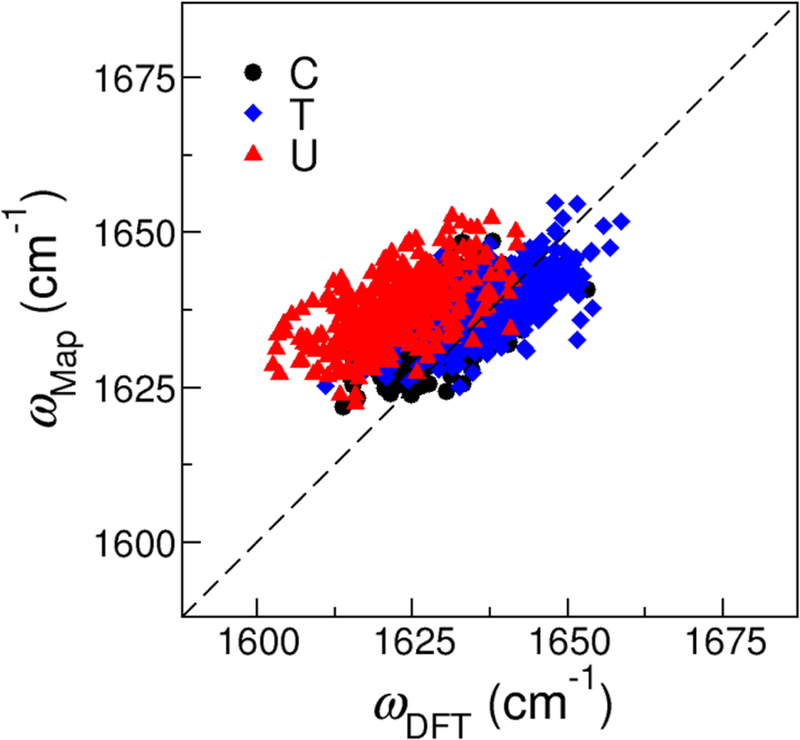
Figure 6:

Correlation plot between the C=C stretch frequencies predicted from the frequency map (ωmap) and from DFT calculations (ωDFT ) for CMP, TMP and UMP. The plot contains 1200 data points from the corresponding NMP-water clusters. The root-mean-square deviation is 10.8 cm−1.
