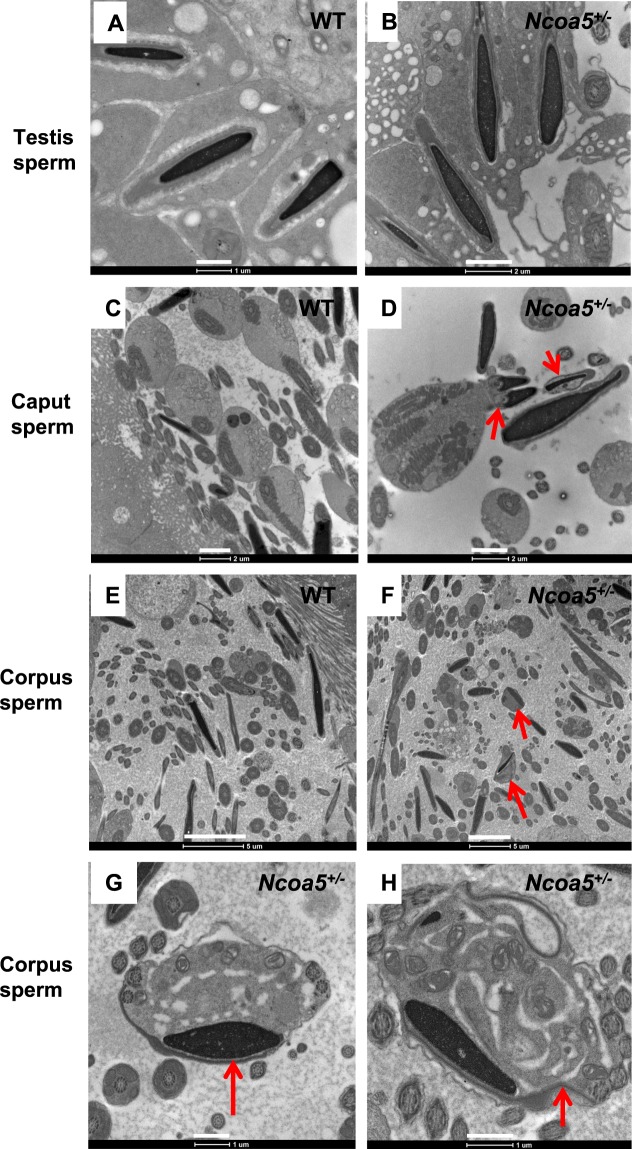
Figure 3.
Representative TEM images of Ncoa5+/− sperm from different parts of the urinary tract. (A,B) Representative TEM images of sperm from testis showed comparable morphology between WT (A) and Ncoa5+/− (B), Scale bars (A): 1μm, (B): 2 μm, (C,D) TEM images of sperm from WT (C) and Ncoa5+/− (D) caput epididymis. Scale bars (C,D): 2 μm, (E–H) TEM images of sperm from WT (E) and Ncoa5+/− (F–H) corpus epididymis, lower magnification (E,F), higher magnification (G,H). Scale bars (E,F): 5 μm, (G,H): 1μm. Red arrow indicates the abnormal morphology of sperm in Ncoa5+/− epididymis.

