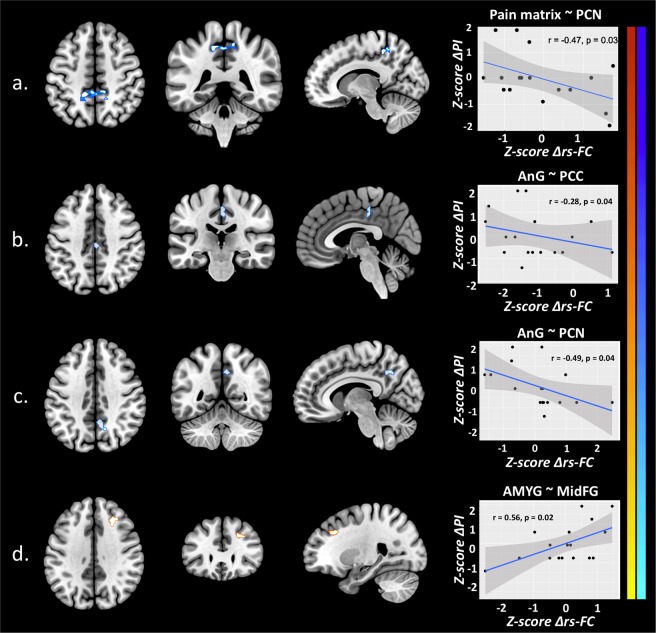
Figure 6.
Music-Induced Analgesia correlates with rs-FC changes in FM patients. Scatterplot/regression line. Correlation between Mpre vs Mpos contrast (∆rs-FC) and ∆PI in FM patients. (a) Pain matrix ~ PCN; (b) AnG ~ PCC; (c) AnG ~ PCN; (d) AMYG ~ MidFG; FM, fibromyalgia patients; Mpre, before music; Mpos, after music; ∆PI, difference of pain intensity; ∆rs-FC, difference in Mpre vs Mpos rs-FC contrast; AMYG, amygdala; AnG, angular gyrus; PCC, posterior cingulate cortex; PCN, precuneus; MidFG, middle frontal gyrus; r, Pearson’s correlation coefficient.

