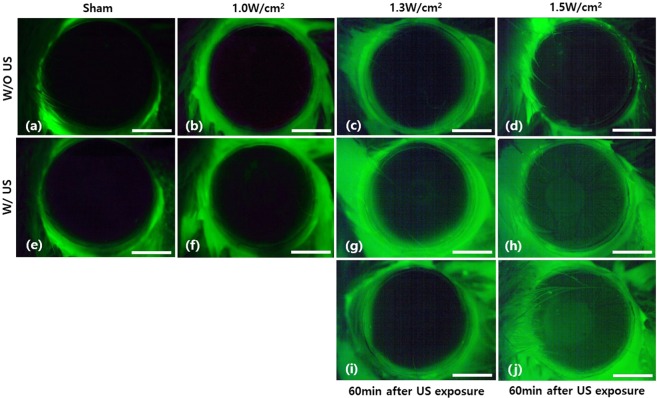
Figure 1.
En-face images of in vivo mouse corneas stained with 0.25% fluorescein solution before and after ultrasound treatment of various intensities. (a–d) and (e–h) En-face images of fluorescein stained mouse corneas before and just after the ultrasound treatment, respectively. Ultrasound intensities for (e–h) were 0 W/cm2 (Sham), 1.0 W/cm2, 1.3 W/cm2, 1.5 W/cm2, respectively. (i,j) En-face mouse cornea images In 60 min after the ultrasound treatment. Ultrasound intensities for (i) and (j) were 1.3 W/cm2 and 1.5 W/cm2, respectively. The scale bar indicates 1 mm.

