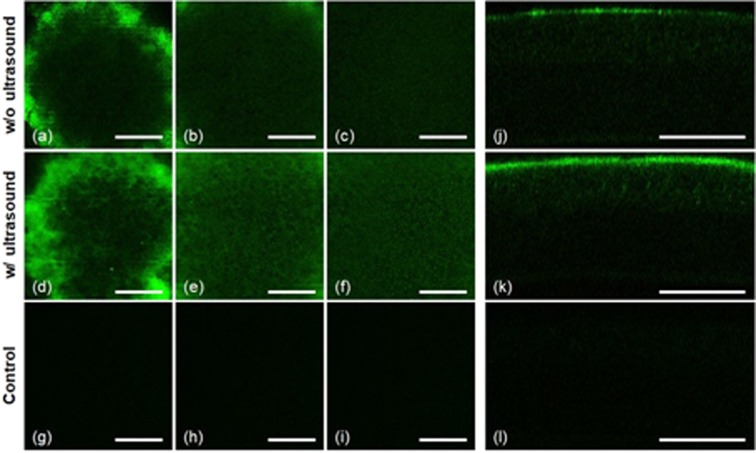
Figure 3.
TPM images of gatifloxacin instilled in vivo mouse corneas without (a–c and j) and with (d–f and k) ultrasound treatment. TPM images were acquired after 10-minute gatifloxacin incubation. (a–c) and (d–f) En-face TPM images of the mouse corneas at 3 different depths without and with ultrasound treatment, respectively (Supplementary Video 3, 4). En-face TPM images at 3 different layers of the superficial epithelium (first column), middle epithelium (second column), and basal epithelium (third column) are presented. (g–i) En-face auto-fluorescence (AF) TPM images of the mouse cornea. (j,k) Cross-sectional TPM images of the gatifloxacin instilled mouse corneas without and with ultrasound, respectively. (l) A cross-sectional AF TPM images of the mouse cornea. The scale bar indicates 100 µm.

