Figure 2.
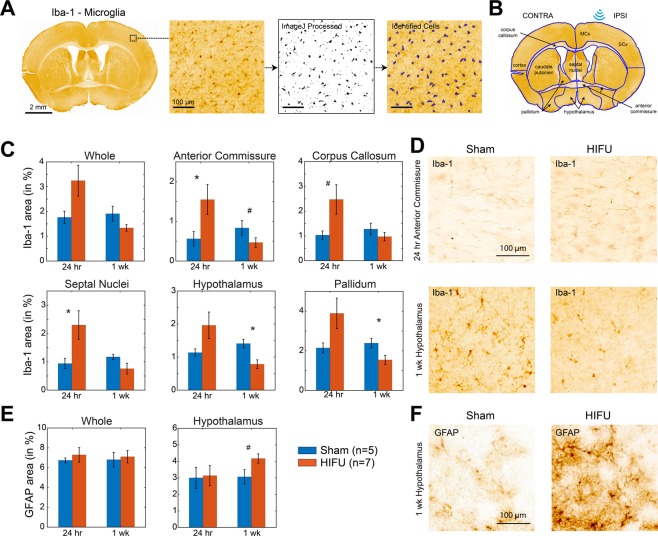
Astrocytes and microglia reactions to high-intensity focused ultrasound exposure. (A) Whole-mount coronal sections at ~0 Bregma stained with Iba1. Magnified images illustrate cell identification and quantification. (B) Same sections as in (A) with brain region and sonication location denotation. (C) shows the percentage of positive Iba-1 stained area to the total area of selected regions. Only regions show statistically meaningful difference between sham and HIFU exposed animals are included. (D) Representative Iba-1 images in anterior commissure at 24 hours post-treatment, and hypothalamus at 1 week post-treatment. E. show the percentage of positive GFAP stained area to the total area of selected regions. Only hypothalamus showed remarkably increase in astrocyte reactivity at 1 week post-treatment. F. Representative GFAP images in hypothalamus at 1 week post-treatment. (n = 5 in control groups, and n = 7 in HIFU groups at each time point. #p < 0.1, *p < 0.05, Wilcoxon rank sum test. Please note that these findings did not show significance in post-hoc Benjamin and Hochberg false discovery rate correction, indicating glial reactions are mild).

