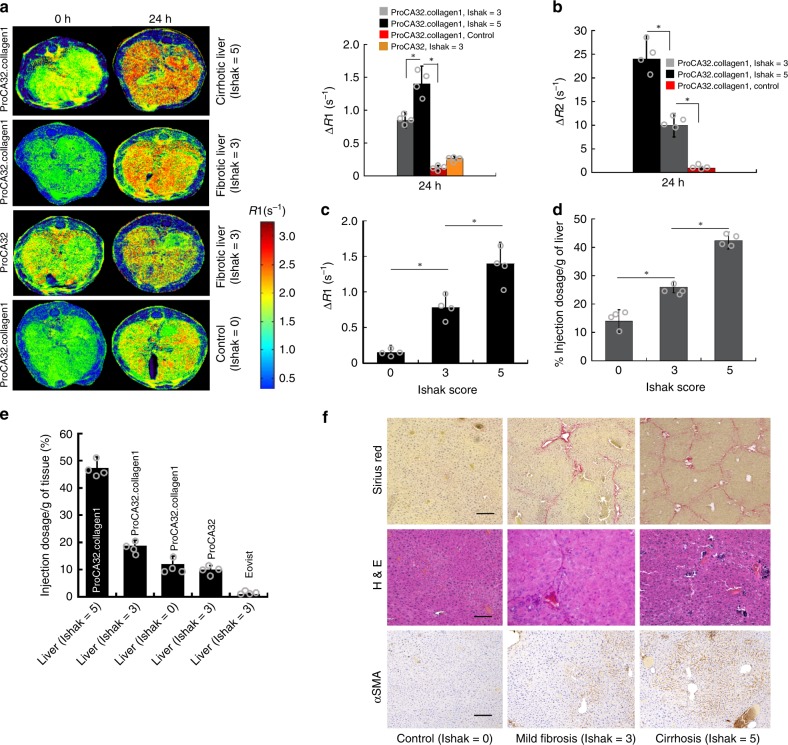
Fig. 2.
Early stage detection of liver fibrosis in TAA/Alcohol model. a R1 maps and ΔR1 values of normal (Ishak stage 0 of 6), early-stage (Ishak stage 3 of 6), and late-stage (Ishak stage 5 of 6) liver fibrosis before and 24 h after injection of ProCA32.collagen1, and ProCA32. b ΔR2 values derived from T2 maps demonstrating the highest enhancement for late-stage liver fibrosis at 24 h post injection. c ProCA32.collagen1 can distinguish early-stage liver fibrosis from normal and late-stage fibrotic liver with ΔR1 derived from a R1 map at 24 h time point. d Correlation between Gd3+ concentration in liver with Ishak score at 24 h time point. e Percent injection dosage of ProCA32.collagen1 based on [Gd3+] in fibrotic and normal livers at 24 h time point. f Sirius red, H&E and αSMA staining of early- and late-stage fibrotic liver compared to normal liver confirms the stage of liver fibrosis. scale bar, 100 µm, *P < 0.05, student’s t test, all data are represented as mean ± SD, n = 4 biologically independent animals in each group

