Fig. 5.
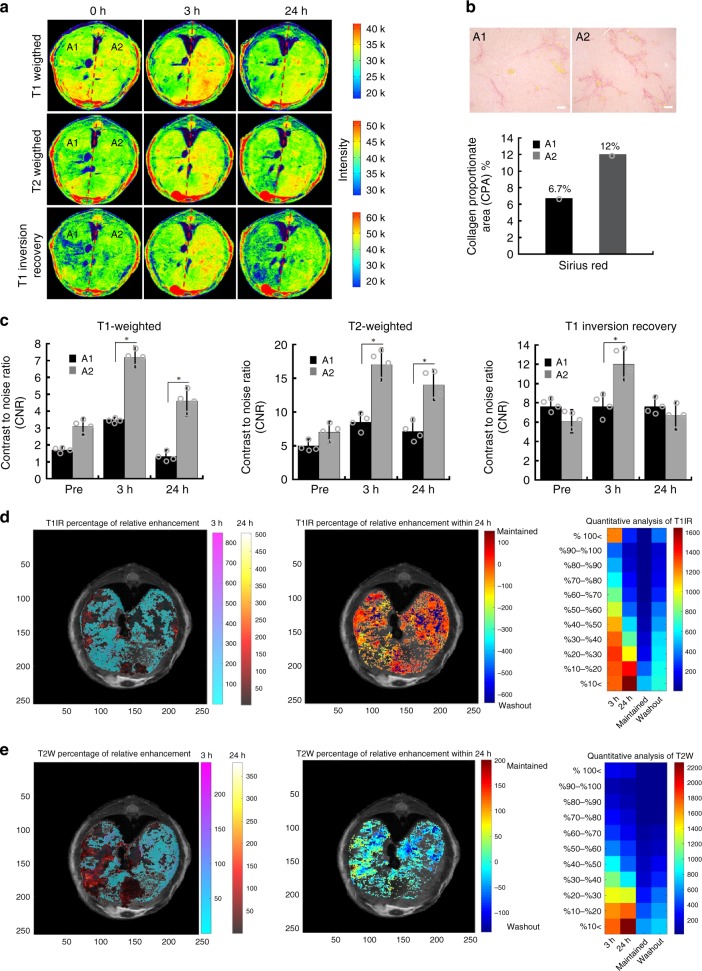
Demonstration of time-dependent mapping of collagen heterogeneity in DEN model. a T1-, T2-weighted, and T1-inversion recovery images of DEN-induced diseased liver before and 3 and 24 h post injection of ProCA32.collagen1 demonstrating collagen heterogeneity of liver in Area 2 (A2). b Sirius red staining and CPA analysis confirmed that A2 has more collagen than A1 which correlates with MRI (scale bar, 100 µm). c T1-, T2-weighted, and T1-inversion recovery images all demonstrated a higher contrast to noise ratio (CNR) in A2 of liver 3 h after ProCA32.collagen1 injection compared to A1. Data are represented as mean ± SD, n = 4 independent images. d Percentage of relative enhancement and quantitative voxel analysis of T1-inversion recovery images demonstrating liver regions enhanced at 3 and 24 h after injection of ProCA32.collagen1 compared to pre-injection (color scale represents number of voxels). e Percentage of relative enhancement and quantitative voxel analysis of T2-weighted images of liver demonstrating regions enhanced at 3 and 24 h after injection of ProCA32.collagen1 compared to pre-injection (color scale represents number of voxels)

