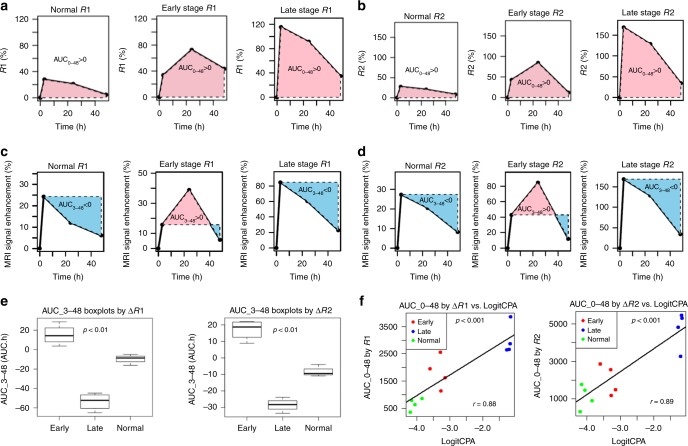
Fig. 6.
Assessment of contrast agent uptake and staging of NASH and liver cirrhosis in NASH diet model. a, b Area under the curve (AUC_0–48 R1 and R2) analysis with ProCA32.collagen1 enhanced MR in NASH diet model. c, d Area under the curve (AUC_3–48 R1 and R2) analysis demonstrates the washout rate of ProCA32.collagen1 3 h post injection in late-stage fibrosis based on decreasing R1 and R2 values and negative value of AUC compared to normal liver and early stage fibrotic liver. e AUC_3–48 h boxplot analysis demonstrating the ability of ProCA32.collagen1 to distinguish normal vs. early stage NASH and early stage NASH vs. late-stage fibrosis in NASH diet model (P < 0.01, unpaired two-tailed student’s t test; the midline is the median of the data, with the upper and lower limits of the box being the third and first quartile, 75th and 25th percentile, respectively. The whiskers extends up to 1.5 times the interquartile range and show the minimum and maximum as they are all within that distance). f Scatter-plots of Logit-transformed CPA against AUC_0–48 showed that AUC_0–48 and CPA levels are well correlated in NASH diet model. P < 0.001, unpaired two-tailed student’s t test; all data are represented as mean ± SD, n = 4 biologically independent animals in each group

