Figure 3.
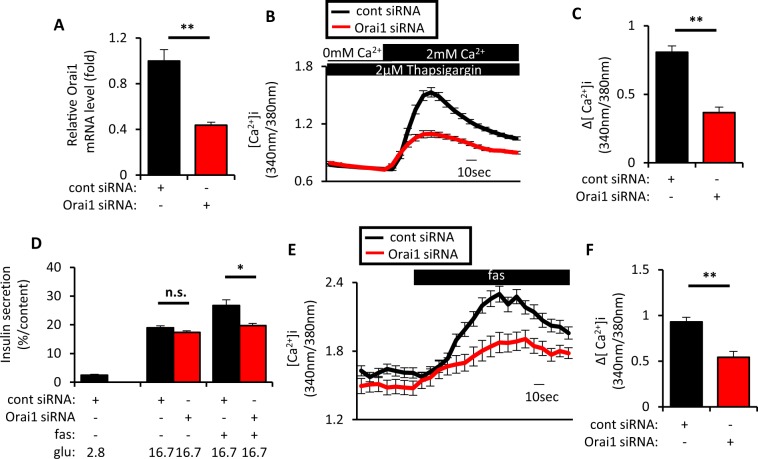
Inhibition of Orai1 suppressed SOCE and fasiglifam-induced intracellular Ca2+ elevation and potentiation of insulin secretion. (A) MIN6 cells were set up on day 0 at 2 × 10⁵ cells per 24 well plate and transfected with 50pmol of control (cont) siRNA and Orai1 siRNA. On day 2, total RNA was extracted from each of the transfected MIN6 cells and subjected to cDNA synthesis followed by real-time PCR to evaluate Orai1 mRNA expression (n = 4 per group). (B) MIN6 cells were set up on day 0 at 4 × 10⁵ cells per 35 mm dish and transfected with 100pmol of cont siRNA or Orai1 siRNA. On day 2, the transfected MIN6 cells were recorded for intracellular Ca2+ concentrations ([Ca2+]i) to evaluate SOCE by fura-2 fluorescence ratio in response to extracellular Ca2+ supplementation (−1–0 min, 0 mM Ca2+/2 μM thapsigargin; 0–3 min, 2 mM Ca2+/2 μM thapsigargin). Traces show average responses of multiple transfected MIN6 cells (cont siRNA, n = 56; and Orai1 siRNA, n = 48). (C) Increment of fura-2 ratio (Δ[Ca2+]i) in response to extracellular Ca2+ supplementation in conditions as in (B) [(Max. value during 0–3 min) − (Average value during −1–0 min)]. (D) MIN6 cells were set up and transfected on day 0 as in (A). On day 2, MIN6 cells were incubated at 2.8 mM or 16.7 mM glucose (glu) with or without 10 μM fasiglifam (fas) for 60 min at 37 °C to evaluate insulin secretion (n = 4–5 per group). (E) MIN6 cells were set up as in (B). On day 2, the transfected MIN6 cells were recorded for intracellular Ca2+ concentrations ([Ca2+]i) evaluated by fura-2 fluorescence ratio in response to various stimuli (−1–0 min, 11.1 mM glu; 0–3 min, 11.1 mM glu/10 μM fas). Traces show average responses of multiple transfected MIN6 cells (cont siRNA, n = 38; and Orai1 siRNA, n = 34). (F) Increment of fura-2 ratio (Δ[Ca2+]i) in response to 10 μM fas in (E) [(Max. value during 0–3 min) − (Average value during −1–0 min)]. Data are expressed as mean ± SEM. * and ** denote p < 0.05 and p < 0.01, respectively, by the Mann-Whitney U-test.

