Fig. 8.
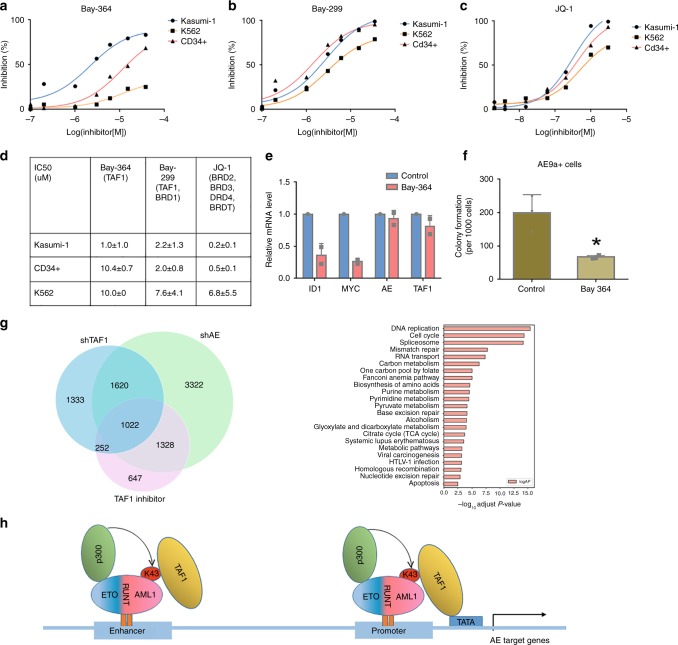
TAF1 bromodomain inhibition reduces the growth of AE-expressing cells. a–c The growth of Kasumi-1 cells, CD34+ cells, and K562 cells in the presence or absence of different concentrations of bromodomain inhibitors Bay-364, Bay-299, or JQ-1. The cell growth was measured by CellTiter-Glow luminescent cell viability assay after 3 days of treatment with the inhibitors or vehicle. Experiments were repeated three times and representative figures are shown. d IC50s (µM) of each inhibitor in Kasumi-1, CD34+, and K562 cells. IC50s were calculated from three independent experiments using GraphPad Prism. Targeted proteins by individual inhibitor are shown in parentheses. e TAF1 inhibitor Bay-364 represses the expression of AE upregulated genes. RNA was extracted from Kasumi-1 cells treated with vehicle or Bay-364 for 72 h. mRNA levels of individual genes were standardized by 18S rRNA level. f TAF1 inhibitor Bay-364 abrogates colony formation in AE9a+ cells. AE9a+ cells were treated with vehicle or 10 μM Bay-364 for 2 days and then 1000 AE9a+ cells were plated on methylcellulose-based medium containing vehicle or Bay-364. Colonies were counted 7 days after plating. The colony numbers from Bay-364-treated cells were compared to the colony numbers from the vehicle-treated cells and p value was determined by Student's t-test. *p < 0.05. g Venn diagrams illustrate the overlapping genes differentially expressed (q < 0.05) after TAF1 KD (shTAF1), AE KD (shAE), or TAF1 inhibitor Bay-364 treatment in Kasumi-1 cells. KEGG analysis was performed on 1022 genes differentially expressed after TAF1 KD, AE KD, and Bay-364 treatment. h TAF1 working model on AE target genes. p300 acetylates AE lysine-43 and the acetylated AE can be recognized by bromodomain of TAF1. TAF1 facilitates the association of AE to either the promoter or enhancer of a subset of AE target genes and then transcription is either activated or repressed. e, f Experiments were repeated independently at least two times. e n = 2, f n = 3. All bars represent the mean ± SD

