Figure 5.
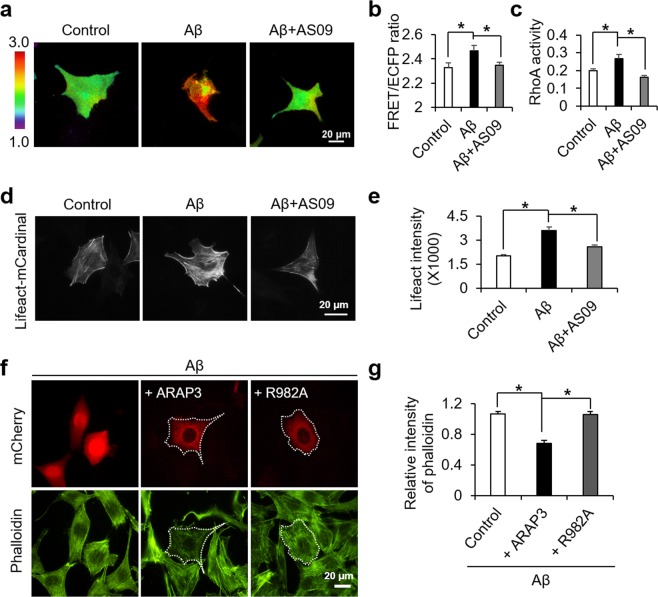
Aβ-induced RhoA hyperactivation and the accumulation of F-actin are dependent on SHIP2 activity. (a,b) Representative images (a) and the averaged values (b) of the FRET/CFP emission ratio images of RhoA biosensor in the HT22 cells stimulated with 1 μM of Aβ in the absence or presence of 10 μM AS09 for 24 hr (means ± SEM; t-test; *p < 0.05; n = 40~42 cells per group). (c) Active RhoA was quantified using ELISA-based RhoA activation assay (means ± SEM; t-test; *p < 0.05; n = 4). (d,e) Representative images (d) and the quantified intensity (e) of lifeact-mCardinal in HT22 cells treated with 1 μM Aβ in the absence or presence of 10 μM AS09 for 24 hr (means ± SEM; t-test; *p < 0.05; n = 80~88 cells per group). (f,g) Representative images (f) and the quantification analysis (g) of phalloidin after the stimulation with 1 μM of Aβ for 24 hr in HT22 cells overexpressing ARAP3 or R982A mutant (means ± SEM; t-test; *p < 0.05; n = 32~40 cells per group).

