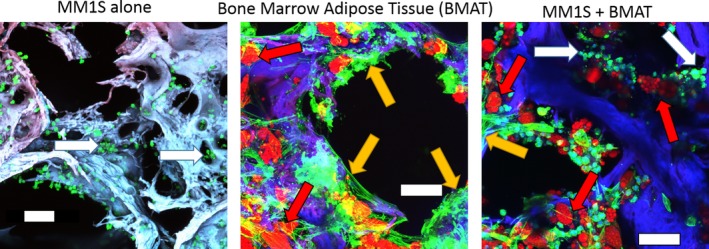
Figure 2.

Example of 3D human bone marrow adipose tissue (hBMAT) coculture with MM1S myeloma cells. Maximum projections of confocal imaging of cocultures. hBMAT was seeded to silk, cultured until confluent, and switched to adipogenic media for 37 days. Then scaffolds were switched to a coculture media and seeded with GFP+/Luc + MM1S cells and imaged at 1 week. Fixed scaffolds were stained with oil red O (lipids = red), phalloidin (actin = green), and 4,6‐diamidino‐2‐phenylindole (nuclei = blue). Scaffold is autofluorescent (blue). Both adipocytes and undifferentiated stromal cells are observed throughout the BMAT. Scale bar = 100 μm. White arrows indicate tumor cells; yellow arrows indicate stromal cells; red arrows indicate adipocytes.
