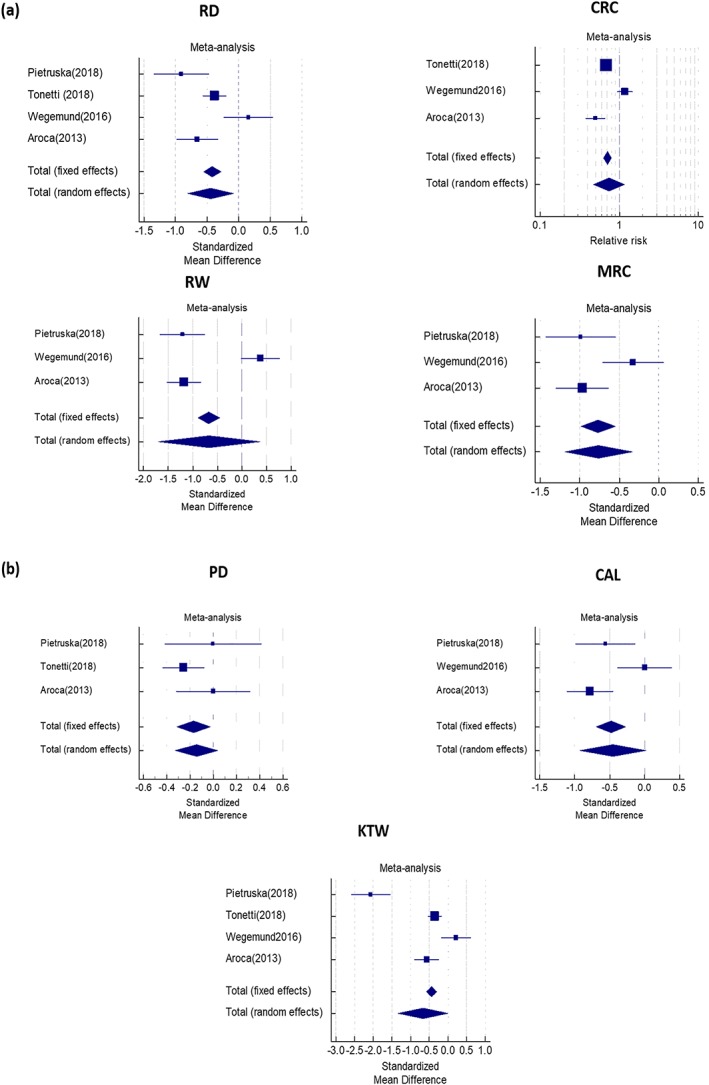
Figure 3.

Forest plots for the primary and secondary outcome variables derived from meta‐analyses (a) recession depth, recession width, complete root coverage, mean root coverage; (b) probing depth, clinical attachment level, keratinized tissue width
