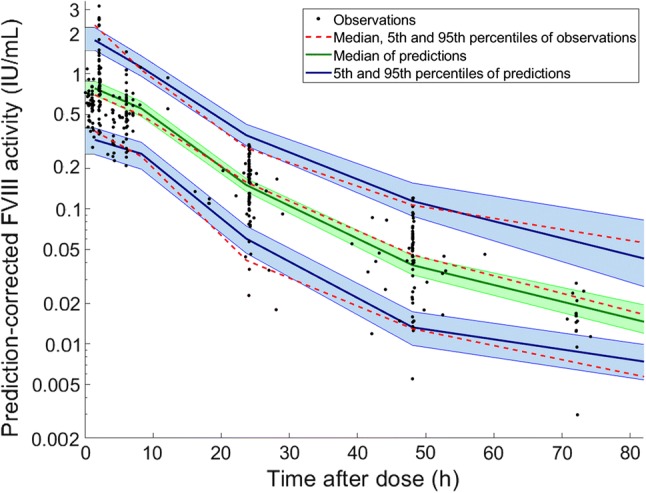
Fig. 3.

Prediction-corrected visual predictive check of the final model. The dashed lines represent the 5th, 50th, and 95th of the observed data. The solid lines and shaded areas are respectively the corresponding simulated data and their 90% confidence intervals. 500 simulations were performed
