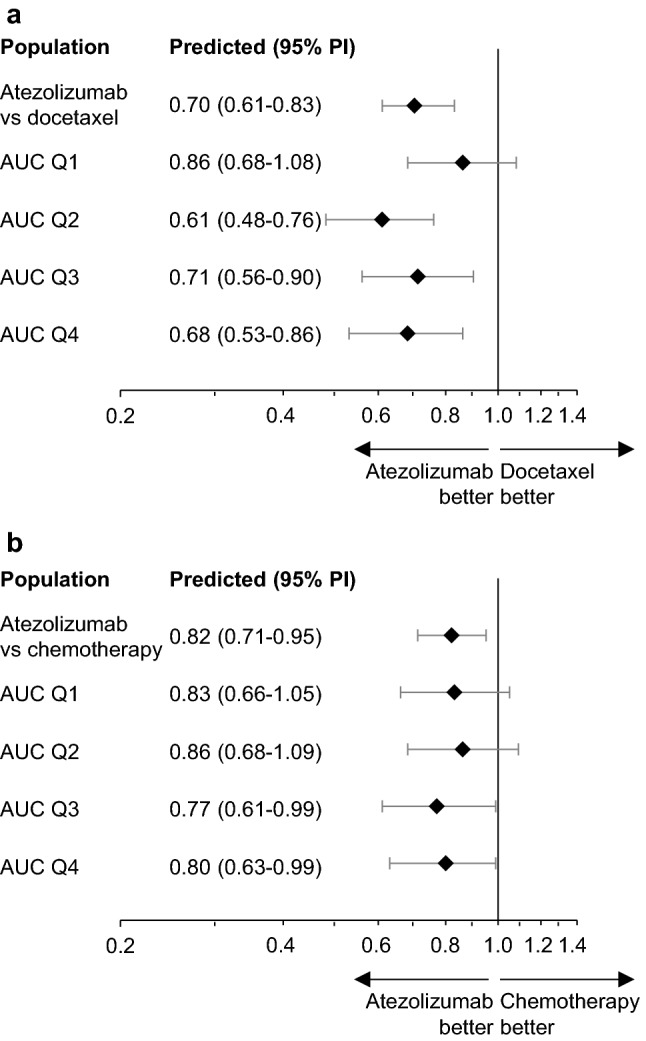
Fig. 2.

Predicted OS HRs (atezolizumab vs comparator) by cycle 1 AUC quartiles for patients with median baseline covariates. Forest plots for OS HRs from (a) OAK (NSCLC) and (b) IMvigor211 (UC) are shown. Model-predicted HRs are shown as diamonds, with bars indicating 95% PIs (1000 replicates). AUC area under the concentration–time curve, HR hazard ratio, NSCLC non-small cell lung cancer, OS overall survival, PI prediction interval, UC urothelial carcinoma
