Fig. 1.

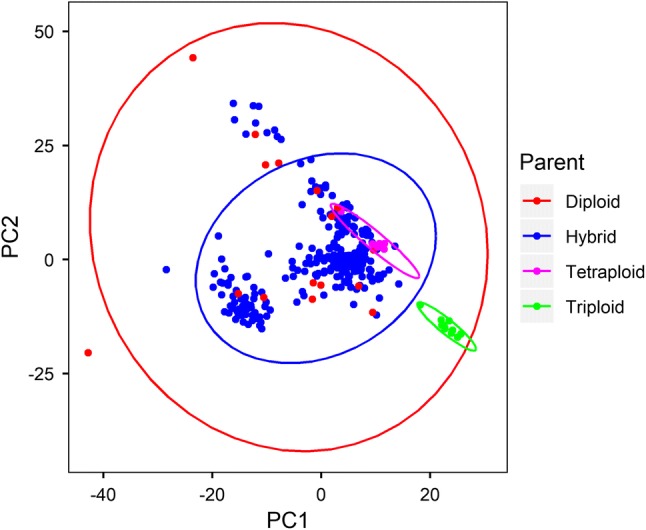
Distribution of genotypes in the study population on the first and second principal components. Where diploid (red), triploid (green) and tetraploid (magenta) are the parents that generated the hybrids (blue) (color figure online)

Distribution of genotypes in the study population on the first and second principal components. Where diploid (red), triploid (green) and tetraploid (magenta) are the parents that generated the hybrids (blue) (color figure online)