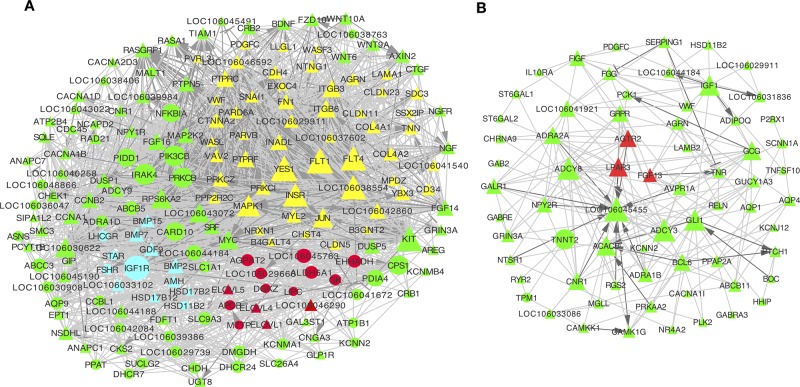
Figure 5.
Network analysis of differentially expressed (DE) mRNAs in granulosa and theca layers. (A, B) Co-expression network of DE mRNAs from top 20 Kyoto Encyclopedia of Genes and Genomes (KEGG) pathways of profiles 2 and 3 in the granulosa layer (A), as well as of profiles 5 and 7 in the theca layer (B). This interaction network includes 53 junctional adhesion-related genes (marked in yellow), 15 lipid metabolism-related genes (marked in red), and 13 genes that are involved in ovarian steroidogenesis (marked in blue) (A). Genes marked with triangles were down-regulated, and those marked with circles were up-regulated during follicle selection. Solid lines indicated direct interactions. Dark grey genes had interactions of activation or inhibition, while light grey lines had interactions without activation or inhibition. Activation →; Inhibition.

