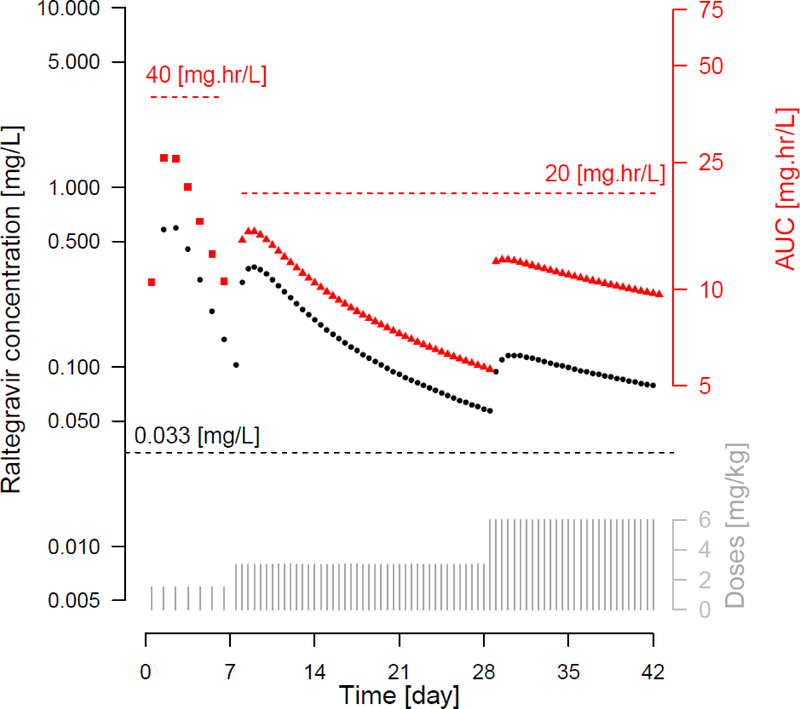
Figure 2.
Simulated Ctrough and AUC profiles for dosing regimen no. 10. Ctrough is plotted against the left axis and AUC against the right axis. Black dots represent Ctrough values, red squares represent AUC0–24 for days 1–7 and red triangles represent AUC0–12 for days 8–42. Dotted lines present the Ctrough criterion ≥0.033 mg/L, AUC0–24 criterion ≤ 40 mg*hr/L and AUC 0–12 criterion ≤ 20 mg*hr/L.

