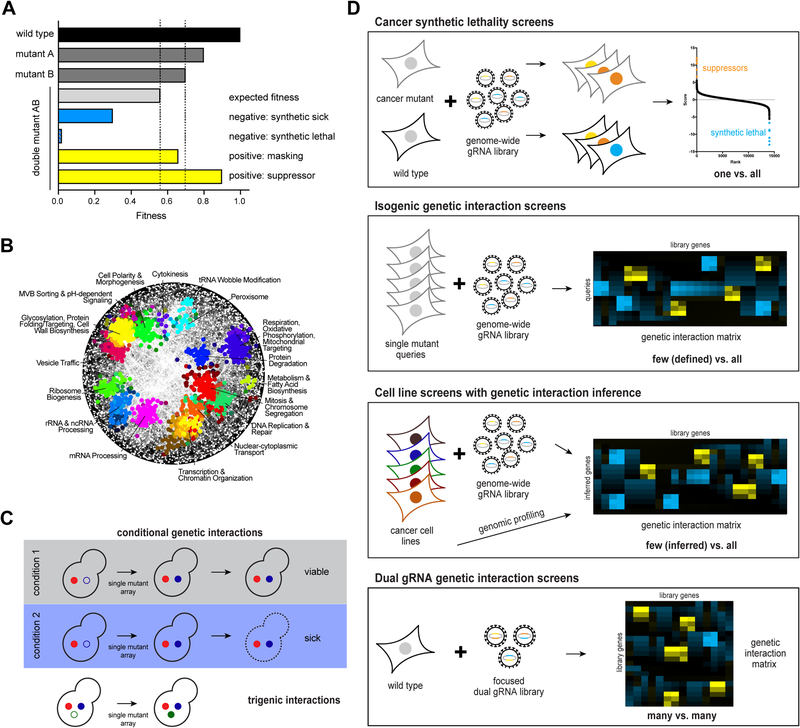
Figure 1: Genetic interaction mapping.
(A) Schematic illustration of genetic interactions as measured by single mutant and double mutant fitness. Negative genetic interactions result in lower double mutant fitness than expected (synthetic sick, synthetic lethal), positive genetic interactions in greater fitness than expected (masking or suppressive). (B) Global pairwise genetic interaction network in yeast reveals functional clustering of genes with similar genetic interaction profiles and allows annotation of uncharacterized genes. (C) Expansion of the yeast functional genomics landscape by conditional and trigenic interactions. (D) CRISPR-mediated genetic interaction screens in mammalian cells. Top, gRNA representation in a cell line harbouring a cancer mutation is compared to a wild type cell line to identify synthetic lethal or suppressive interactions. Second, a limited number of defined mutants are generated in an isogenic cell line background and subjected to genome-scale CRISPR screening. Clustering by genetic interaction profile similarity reveals functional information. Third, instead of isogenic mutants, patient-derived cancer cell lines are used. In addition to CRISPR screening, genomic profiling is required to infer the “single mutant state” in those cell lines. Bottom, Direct assessment of pairwise genetic interactions between a limited set of genes by simultaneous delivery of two gRNAs into the same cell.

