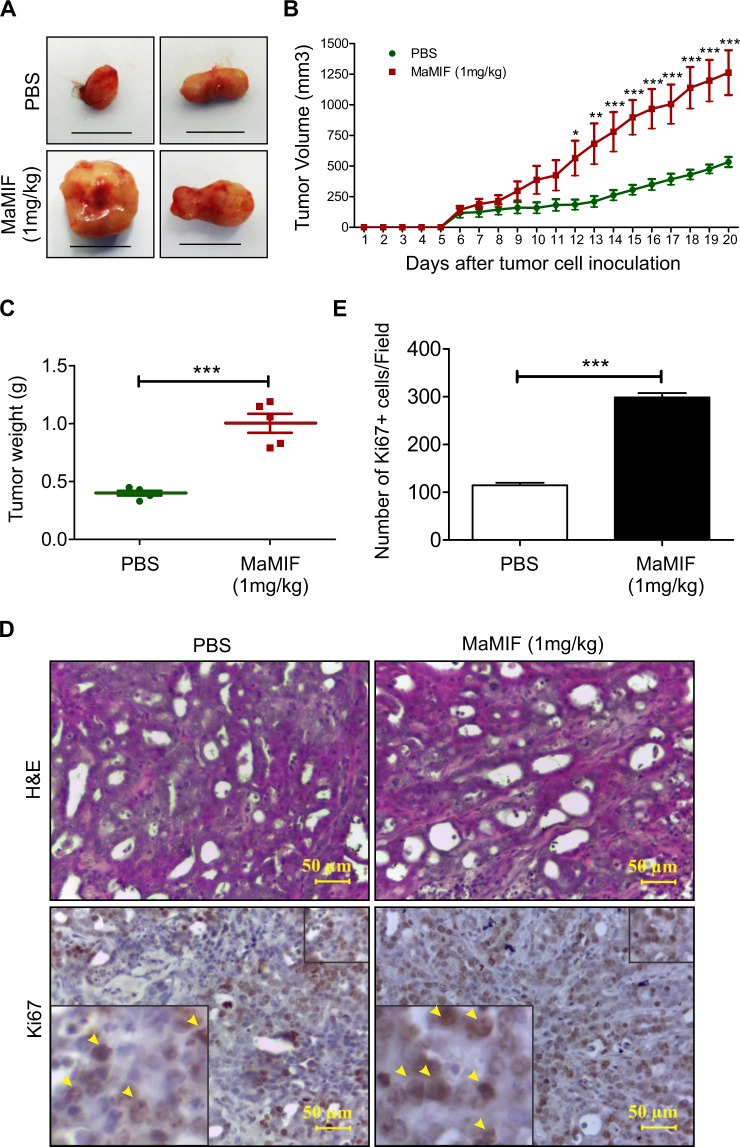
Figure 4.
Effect of MaMIF on HapT1 tumor growth in its syngeneic host. (A) Representative digital images of HapT1 tumors obtained from PBS or MaMIF injected animals show bigger tumor mass in MaMIF injected groups. The scale bar is equivalent to 1 cm. (B) Graphical representation of tumor volume calculated every day after initiation of treatment revealed a significant increase in the tumor growth in MaMIF injected animals (n = 5). Data represents the mean ± SEM, ***p < 0.0001 using two-way ANOVA. (C) The dot-plot graph showing a significant increase in HapT1 tumor weight in MaMIF treated animals than control (n = 5). Data represents the mean ± SEM, ***p < 0.0001 using a Student t-test. (D) Hematoxylin and Eosin (H&E) stained HapT1 tumor tissue sections show moderately differentiated tumors in all the conditions (PBS or MaMIF injected). The lower panel representative images show tissue sections stained with Ki67 antibody. Images were captured at 40× magnification. (E) Graph showing the number of Ki67 positive cells/field (n = 5). Data represents the mean ± SEM, ***p < 0.0001 using a Student t-test.

