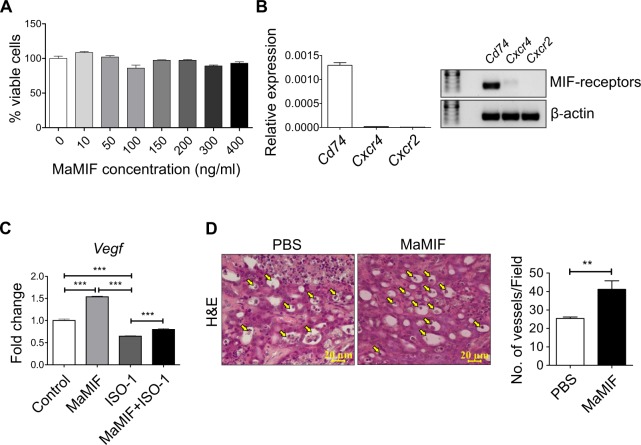
Figure 5.
Effect of MaMIF on HapT1 cells growth and angiogenesis. (A) Graph showing the percentage of viable cells upon treatment with different concentrations of MaMIF after 48 hours. (B) Graph showing the relative expression of Cd74, Cxcr4 and Cxcr2 in HapT1 cells and agarose gel image showing the amplified products in qPCR. Relative expression is calculated using formula 2−dCT, dCT = CTgene − CTβ-actin. (C) Graph showing the expression of Vegf in HapT1 cells following stimulation with MaMIF (100 ng/ml), ISO-1 (100 µg/ml) and MaMIF + ISO-1 for 48 hours (n = 3). Each bar represents the mean ± SEM. ***p < 0.0001 using one-way ANOVA with Bonferroni’s Multiple Comparison Test. (D) Representative H&E images (captured in 40x magnification) showing the number of blood vessels (arrows indicated) in PBS and MaMIF treated tumor tissues. Quantification was done by counting the number of vessels/field in 20x magnification images. Each bar represents the mean ± the SEM. **p < 0.001 using a Student t-test.

