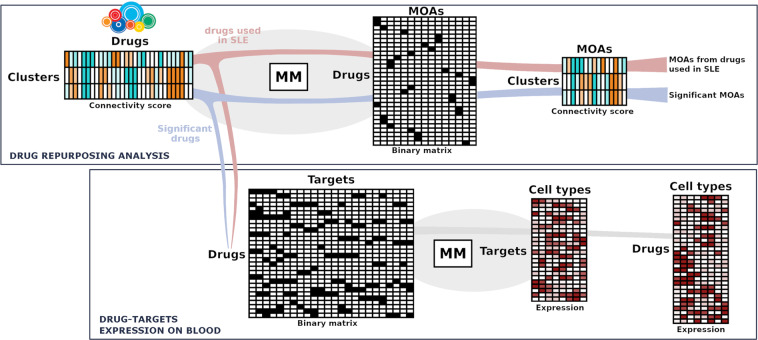
Figure 5.
Summary and flow of the drug connectivity analyses. Based on the connectivity scores obtained in CLUE for each drug within each cluster, we analyzed on the one hand the drugs commonly used in SLE (red branch) and on the other hand, the drugs with score > = 90 in absolute value (blue branch), from which we extracted the significant MOAs by means of multiplication of matrices (MM). Subsequently, by matrix multiplication we obtained the relative expression of the targets of each drug in the blood cell types. The pairs of matrices that are multiplied are linked in the diagram by a shaded circle.

