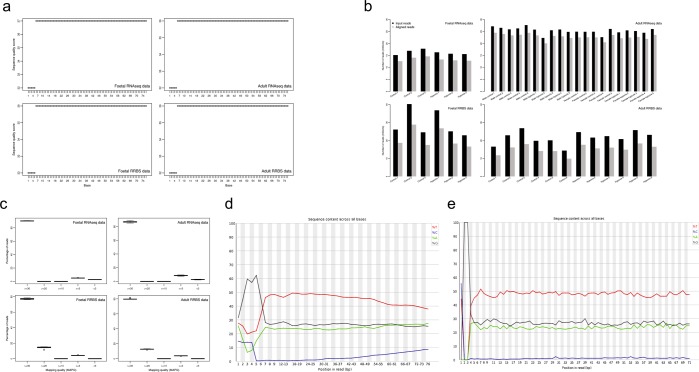
Fig. 3.
Quality metrics of raw and aligned reads. (a) The distribution of median phred quality score per base across all samples in fetal RNA-seq, adult RNA-seq, fetal RRBS, and adult RRBS data sets. (b) Number of reads before and after alignment of all samples in four data sets. (c) Distribution of percentages of aligned reads across different mapping quality ranges in four data sets. (d–e) An example of percentage of sequence content per base before and after NuGEN diversity trimming in two RRBS data sets (sample: C1_6).

