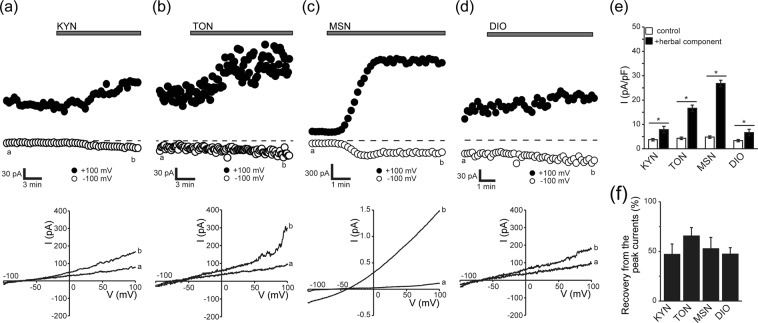
Figure 2.
Activation of whole-cell membrane conductance evoked by KYN, TON, MSN, or DIO in Caco-2 cells under a nystatin-perforated patch-clamp. (a–d) Responses of whole-cell currents to stimulation by KYN, TON, MSN, or DIO, respectively. Top panels: Representative time courses of changes in whole-cell currents recorded at −100 mV (open circles) and +100 mV (filled circles) before and after application of each herbal component at 400 μg/ml during application (every 10 s) of ramp pulses of −100 to +100 mV from a holding potential of −60 mV. Bottom panels: Corresponding I-V relationships recorded at time points a and b in the top panels. The reversal potentials of these herbal component-induced currents were determined from the intersection of the I-V curves obtained in the absence and presence of a herbal component: KYN (−70.6 ± 1.7 mV, n = 7), TON (−72.5 ± 1.0 mV, n = 9), DIO (−73.2 ± 1.6 mV, n = 5), MSN (−40.1 ± 1.9 mV, n = 5). (e) Peak current densities measured at +100 mV before (control) and after (+herbal component) application of KYN, TON, MSN, and DIO. Each column represents the mean ± S.E.M. (n = 5–8). *P < 0.05 compared with the control value. (f) Percent recovery from peak whole-cell currents at 15 min after washout of the herbal component (KYN, TON, MSN, or DIO) calculated by the equation: % Recovery = 100 − (100 × [(I2 − I1)/(I3 − I1)], where I1 is the amplitude of the control current at +100 mV before herbal component application, I2 is the peak current attained after application of the herbal component, and I3 is the current measured at 15 min after washout of the herbal component. Each column represents the mean ± S.E.M. (n = 5–7).

