Figure 5.
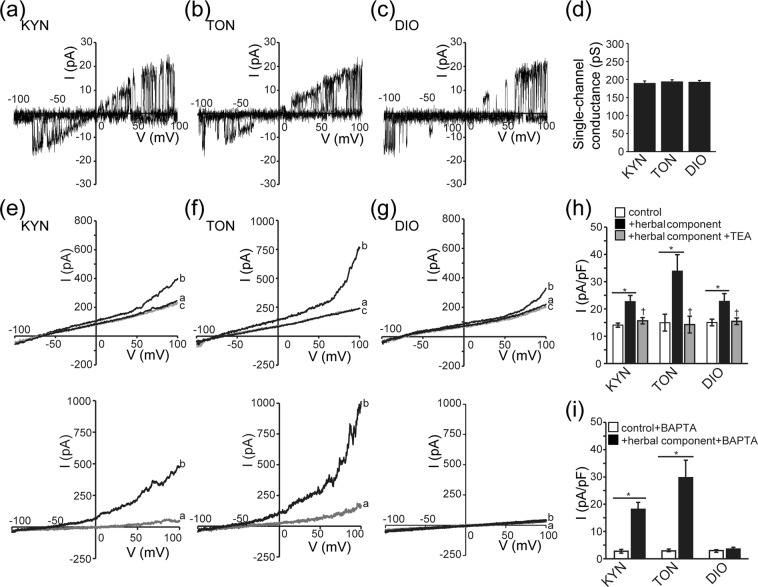
Activation of whole-cell and single-channel K+ currents in Caco-2 cells evoked by KYN, TON, and DIO. (a–c) I-V relationships of current responses to each herbal component (400 μg/ml) recorded upon application of ramp pulses of −100 to +100 mV from a holding potential of −60 mV under the indicated conditions. Single-channel events observed during application of ramp pulses in the cell-attached mode of a patch-clamp in a high K+ bath solution. Representative single-channel currents were observed only when a small number of channels were activated at the beginning of stimulation by each herbal component. (d) Single-channel conductance calculated by the slope of the I-V curves from the reversal potential to +100 mV. Each column represents the mean ± S.E.M. (n = 5). (e–g) Top panels: Inhibitory effects of 5 mM TEA on KYN-, TON- and DIO-induced whole-cell currents. I-V relationships were recorded upon application of ramp pulses before (a) and after stimulation with each herbal component alone (b) or together with TEA (c). Bottom panels: Effects of intracellular dialysis with 5 mM BAPTA on KYN-, TON- and DIO-induced whole-cell currents. I-V relationships were recorded upon application of ramp pulses before (a) and after stimulation with each herbal component alone (b). (h) Peak current densities recorded at + 100 mV before (white columns) and after application of each herbal component in the absence (black columns) and presence (grey columns) of TEA. Each column represents the mean ± S.E.M. (n = 5–6). *P < 0.05 compared with the control value. †P < 0.05 compared with the herbal component-stimulated value in the absence of TEA. (i) Peak current densities recorded in the presence of intracellular BAPTA (5 mM) at +100 mV before (white columns) and after (black columns) application of herbal components. Each column represents the mean ± S.E.M. (n = 5–6). *P < 0.05 compared with the control value.

