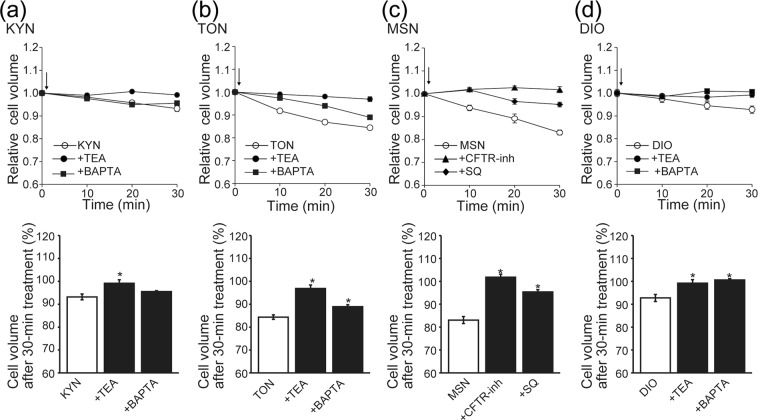
Figure 6.
Sensitivity of SVD to TEA induced by KYN (a), TON (b), and DIO (d) and sensitivity of MSN-induced SVD to CFTR-inh or SQ22536 (c) in Caco-2 cells. Top panels: Time courses of changes in the mean cell volume. At time 0, each herbal component (400 μg/ml) was applied alone (open circles) or together with 5 mM TEA (filled circles), 10 μM CFTR-inh (filled triangles), or 100 μM SQ22536 (filled diamonds). Bottom panels: Percentage of the cell volume after 30 min of treatment relative to the initial cell volume. Each column represents the mean ± S.E.M. (n = 5). *P < 0.05 compared with the data of each herbal component alone.

