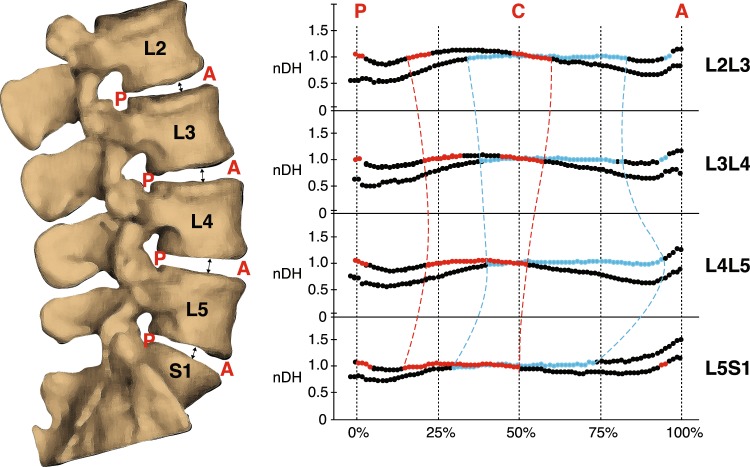
Figure 3.
Average normalized disc height (nDH) along the AP axis of the disc at each segment level. Black-blue lines represent nDH at the upright position, while black-red lines represent nDH at the flexed position. The colored (blue or red) sections of each line indicate nDH values from 0.95–1.05 (±5% of central nDH) which roughly correspond to the nucleus pulposus of the disc. Superimposed colored and dashed lines illustrate differences in NP migration between segment levels.

