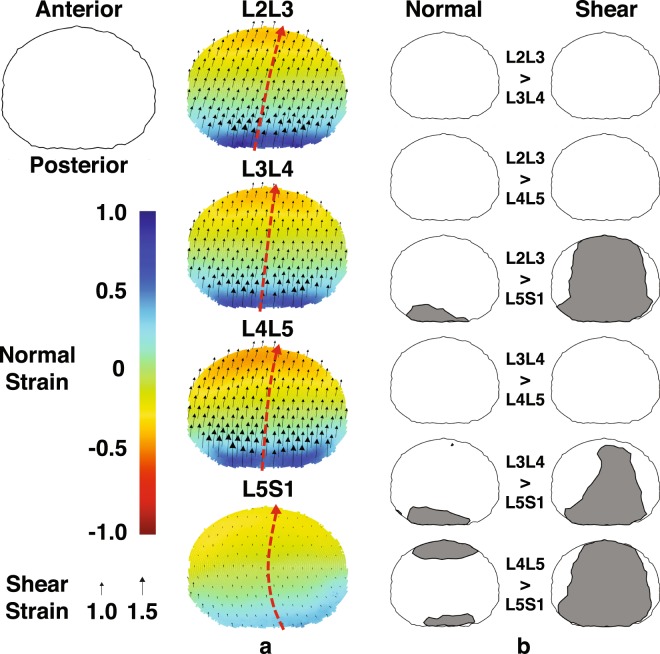
Figure 5.
Mapping of disc strain across the axial planar surfaces of the lumbar discs from the L2 to S1 at the flexed position with respect to the upright reference frame. (a) Distribution of the average normal (color) and shear (black arrows) strains across the entire disc at the flexed position. Positive (more blue) and negative (more red) values indicate distraction and compression of the disc, respectively, while zero normal strain is displayed as green. Black arrows indicate both the magnitude and direction of shear strains. Superimposed red arrows intersecting the center of the disc indicate the approximate change in shear strain direction from the posterior to anterior end of the disc. (b) Areas exhibiting significantly different normal (left) and shear (right) strain values between segment levels at the flexed position based on non-overlapping ±95% confidence intervals.

