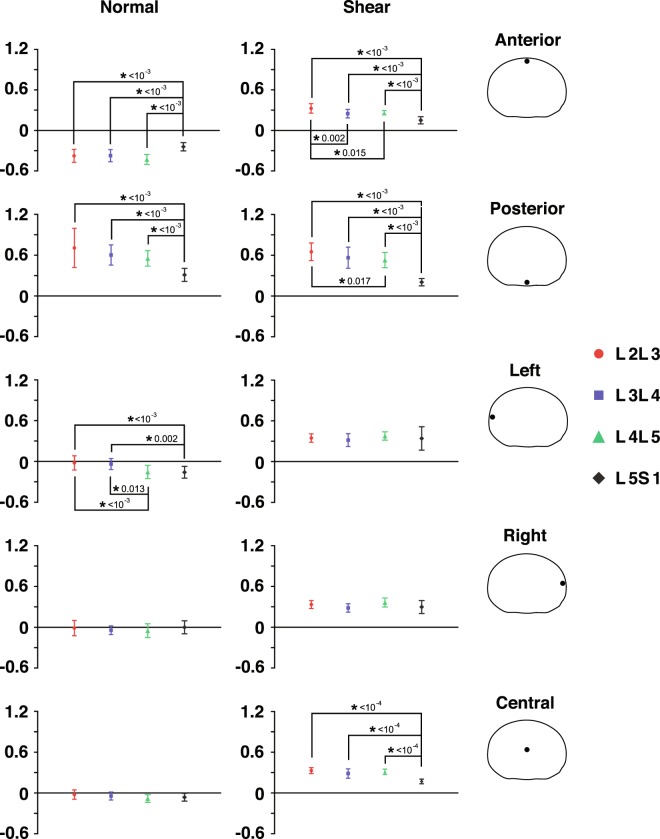
Figure 6.
Average disc deformation of five regions of the disc at each segment level. Normal (left) and shear (right) deformations at the flexed position are computed at the anterior, posterior, left, right, and center regions of the disc. Error bars represent ±95% confidence intervals. An asterisk indicates a significant difference between segment levels and is accompanied by its associated p-value as assessed by Repeated Measures ANOVA.

