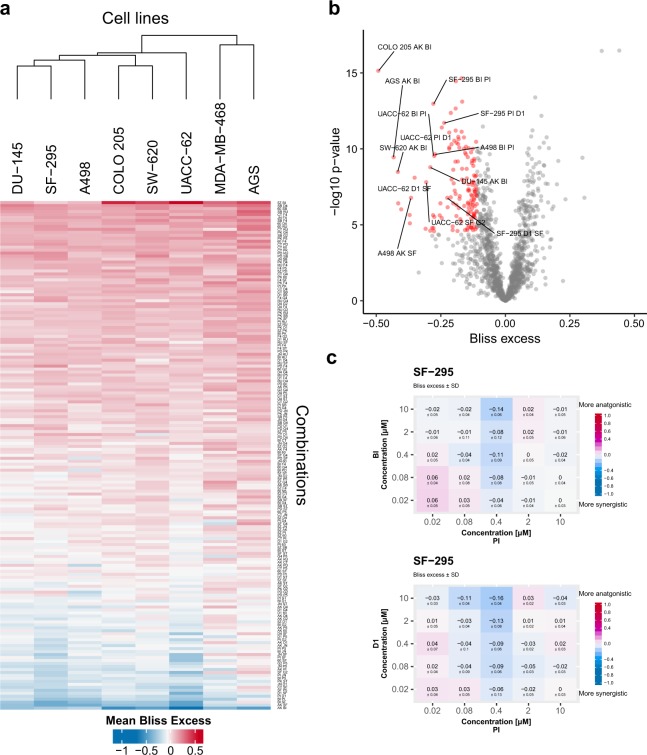
Fig. 3.
Overview of synergy scores of all drug combinations across all tested cell lines. (a) The heatmap shows Bliss excess across the eight cell lines tested in this study, where a negative value indicates a stronger synergy. Bliss excess ≤ −0.11 are coloured in blue (synergy), while values ≥ 0.11 are coloured in red (antagonism). Cell lines are clustered using Euclidian distances of synergy strengths, while rows are sorted according to mean Bliss excess across all cell lines. (b) Volcano plot showing synergy strength (Bliss excess) vs significance scores of synergistic responses. (c) Average Bliss excess ± standard deviation for SF-295 cells treated with Doramapimod (BI) in combination with PI-103 (PI) and BI-D1870 (D1) in combination with PI from secondary screen.

