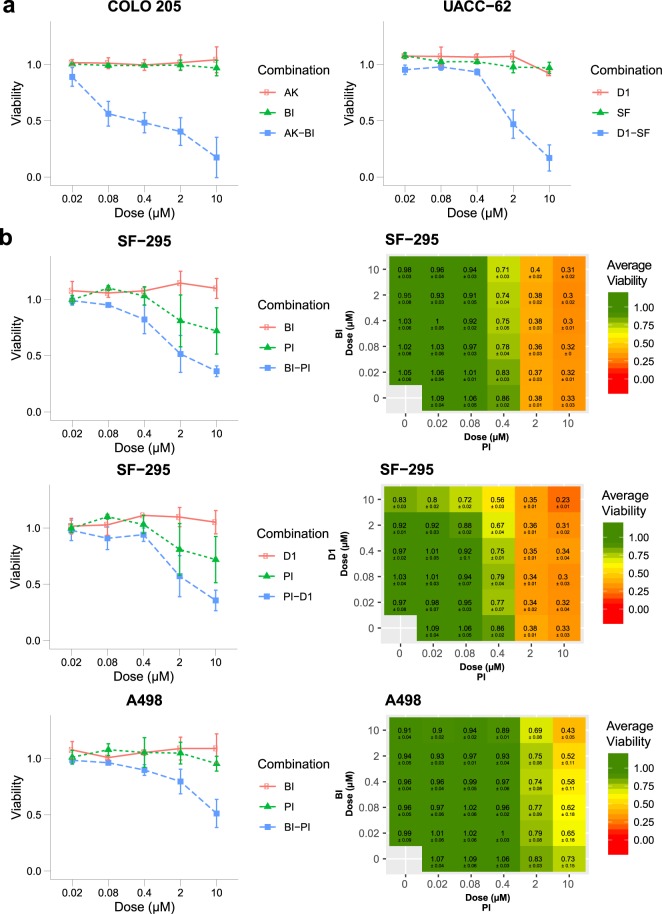
Fig. 4.
Example drug combination plots for drug combinations found to be highly synergistic according to Bliss excess and p-value. (a) The graphs show viability data with standard deviation for COLO 205 cells tested Doramapimod (BI) and Akt Inhibitor VIII (AK) and UACC-62 cells tested with BI-D1870 (D1) and SF1670 (SF) in the primary screen. (b) The graphs show viability data with standard deviation for SF-295 cells treated with drug combinations Doramapimod (BI) - PI-103 (PI) and BI-D1870 (D1) - PI, and A498 cells treated with BI - PI in the primary and secondary screen. The data is normalised to DMSO control.

