Fig. 3.
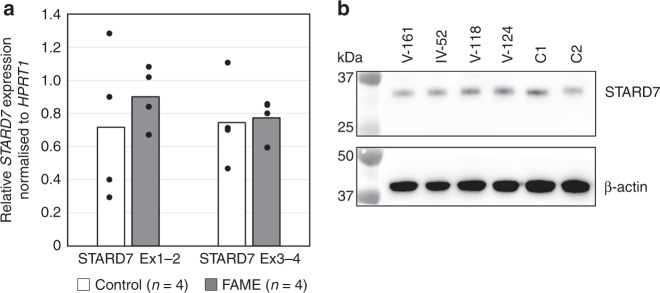
Expression of STARD7 is unaltered in patient-derived skin fibroblasts. a Graph shows average STARD7 expression by relative standard curve quantitative PCR (qPCR) normalised to HPRT1 expression in fibroblast cell lines from four control donors (white bars) and four affected male individuals from Family 1 (IV-52, V-118, V-124 and V-161; black bars). Individual data points overlay the each bar. Tests for significance were performed using Student’s two-tailed t-test assuming unequal variances (p = 0.50 Exon 1–2; p = 0.85 Exon 3–4). b Western blot of STARD7 protein compared to β-actin on the same blot of fibroblasts from the same four individuals from Family 1 as assayed by qPCR and two male control donors (C1 and C2). Data underlying this figure are available in Source Data

