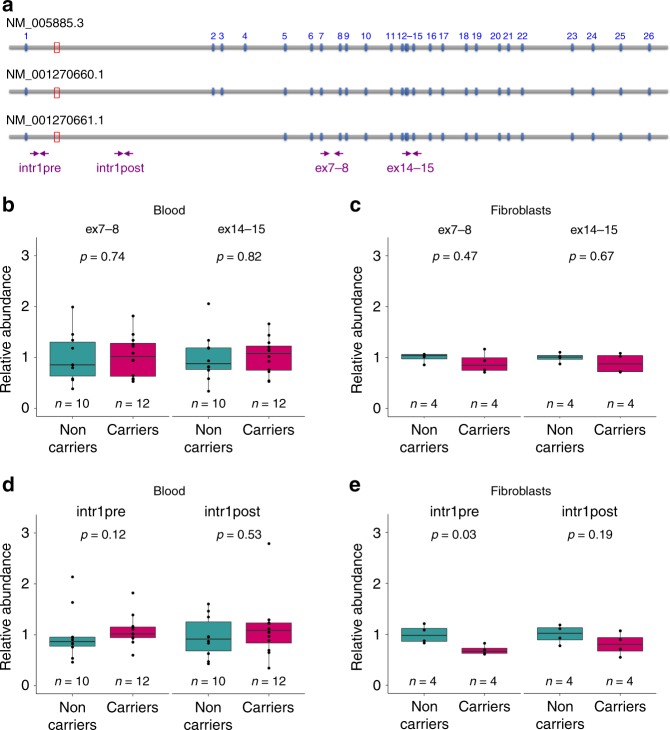
Fig. 6.
Expansions do not affect MARCH6 expression in blood or skin. a Schematic representation of the MARCH6 transcript isoforms. The site of the expansion is indicated by the red box. Arrows indicate primer pairs used to quantify MARCH6 gene expression. b Results of real-time RT-PCR in blood from expansion carrier (n = 12) versus healthy (n = 10) individuals with primers specific of exons 7–8 (left) and exons 14–15 (right). c Results of real-time RT-PCR in fibroblasts from expansion carrier (n = 4) versus unrelated control (n = 4) individuals with primers specific of exons 7–8 (left) and exons 14–15 (right). d Results of real-time RT-PCR in blood from expansion carrier (n = 12) versus healthy (n = 10) individuals with primers located in intron 1 before (left) or after (right) the expansion. e Results of real-time RT-PCR in fibroblasts from expansion carrier (n = 4) versus unrelated control (n = 4) individuals with primers located in intron 1 before (left) or after (right) the expansion. Box plots elements are defined as follows: center line: median; box limits: upper and lower quartiles; whiskers: 1.5× interquartile range; all values are displayed as points; outliers are shown as disconnected points. Statistical comparisons were done using a Wilcoxon–Mann–Whitney rank-sum test (two-sided)

